Validio + Google BigQuery
Engineering

How to do Deep Data Observability in Google BigQuery

Thursday, Feb 16, 202310 min read
Emil Bring

TL;DR

Deep Data Observability means the ability to monitor data everywhere, in any storage format, and in whatever cadence is necessary. In this article, we explain how Validio can be used to catch and fix data quality issues inside BigQuery tables. We walk you through how to:

  • Connect Validio to BigQuery.
  • Configure validators that detect anomalies down to datapoint level.
  • Use Dynamic Segmentation for root-cause analysis.
  • Send automated notifications whenever bad data is found.
  • Validio catches bad data end-to-end, regardless if it's stored in data warehouses like BigQuery or Snowflake, in data lakes built on e.g. GCS or S3, or real-time streams like Kinesis and Kafka.

    Introduction 

    Google BigQuery is one of the most popular data warehouses on the market today, and arguably, the most popular one among data teams in the Nordics. It offers many benefits like serverless architecture, built-in lineage, and custom SQL functions compatible with JavaScript.

    In this article, we explore how Validio can be used to reach Deep Data Observability on BigQuery tables for maximum data quality. To do this, we follow a simple e-commerce scenario and dataset: from connecting Validio and configuring validators that detect anomalies to receiving notifications when bad data is found. After reading this, you should have a firm grasp of how you can implement Validio to validate your BigQuery data yourself.

    Table of contents

    A simple business scenario

    Set up Deep Data Observability with Validio

    What’s next?

    A simple business scenario

    To illustrate Validio’s capabilities, we’ll use a simple business scenario.

    OmniShop, a fictional e-commerce company, has a data team of three data engineers. They provide data for sales reporting and other use cases that rely heavily on accurate data, such as recommendation engines and other machine learning (ML) applications.

    In this scenario, we’ll follow one of the data engineers, Julia, who spends at least half of her time firefighting bad data and debugging pipelines. The frequency of data failures has started to erode the company’s trust in data and, by extension, the company’s trust in the data team.

    Up until now, Julia has been manually writing data quality checks for their BigQuery tables using dbt and its extension packages, including dbt_expectations. Because the testing possibilities in dbt_expectations are limited, Julia has also written custom data quality tests in SQL. However, since the company has grown significantly lately, so has its number of data sources and transformations in BigQuery. With more data sources comes more business logic—manual tests simply don’t scale.

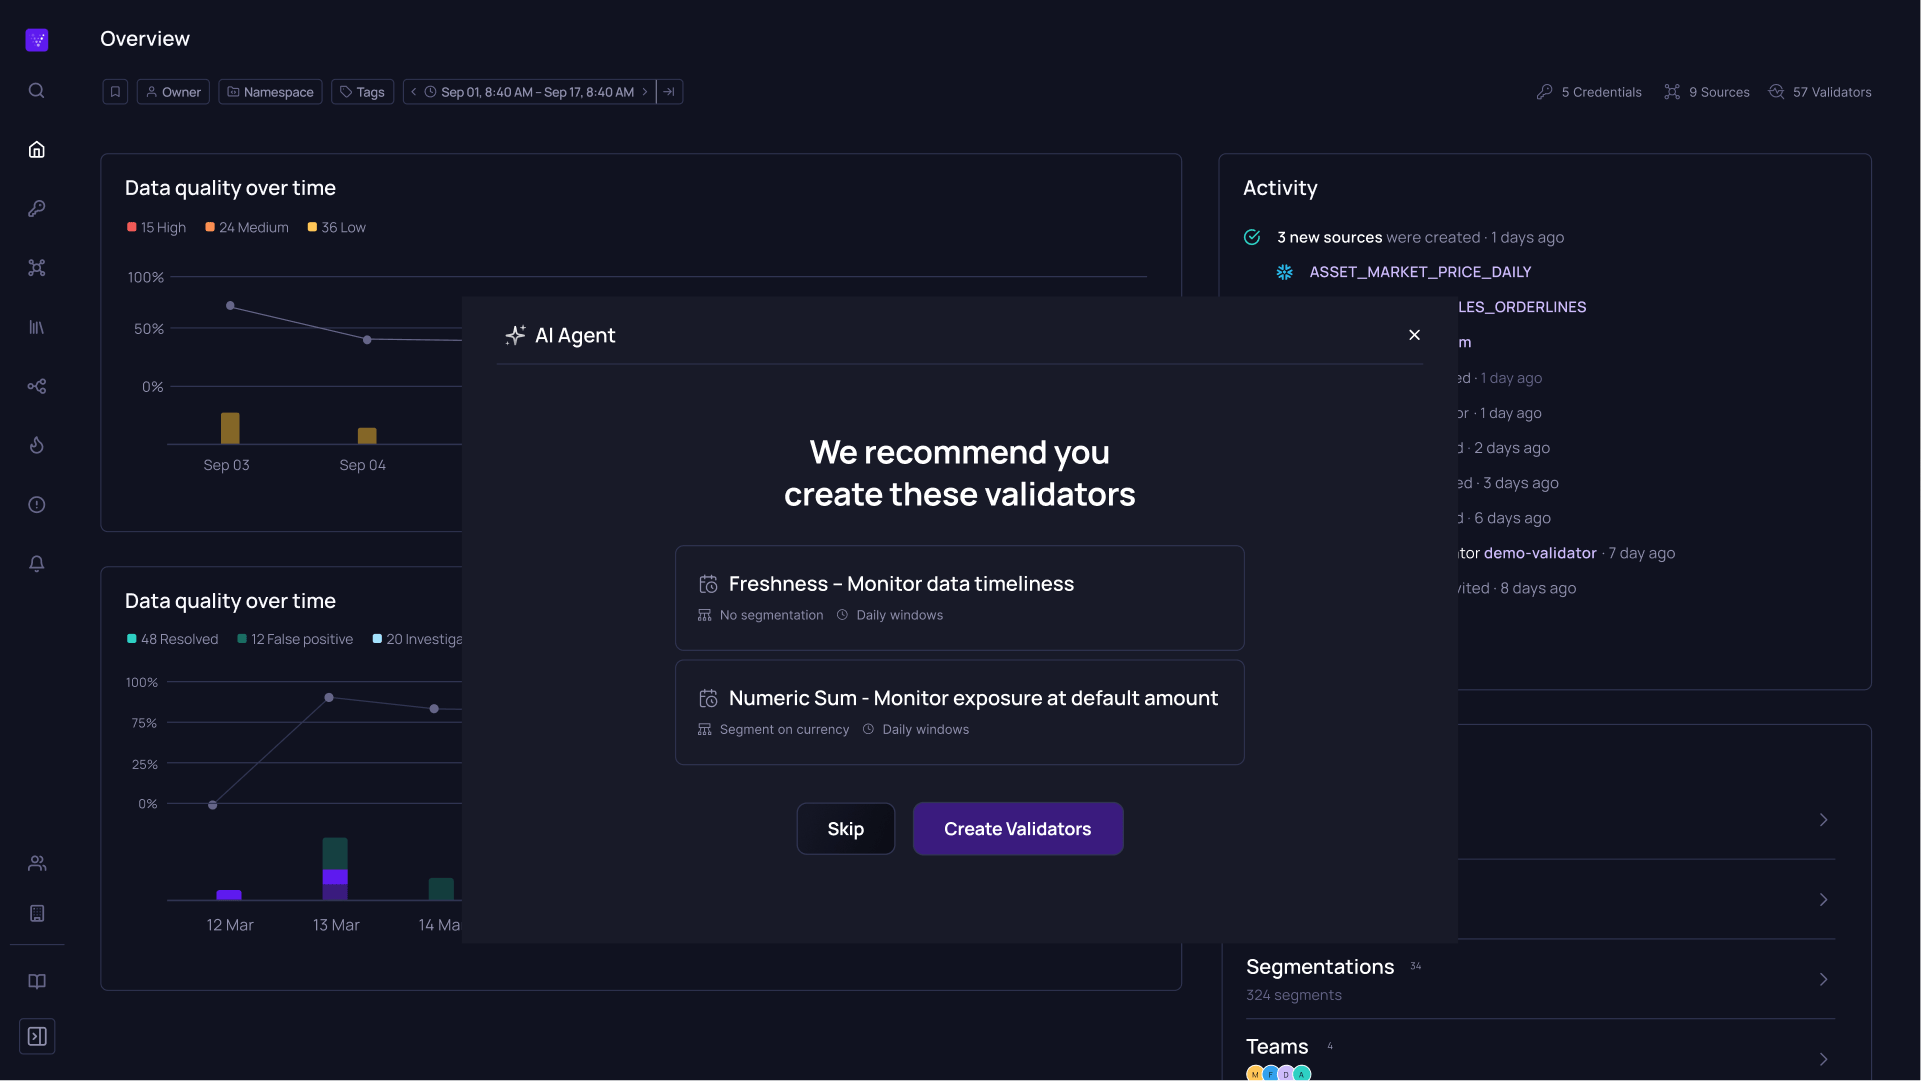
    To combat this, Julia and her team have decided to implement Validio's Deep Data Observability platform. By achieving full visibility into their data pipelines, they hope to regain control of their data quality even as the organization grows.

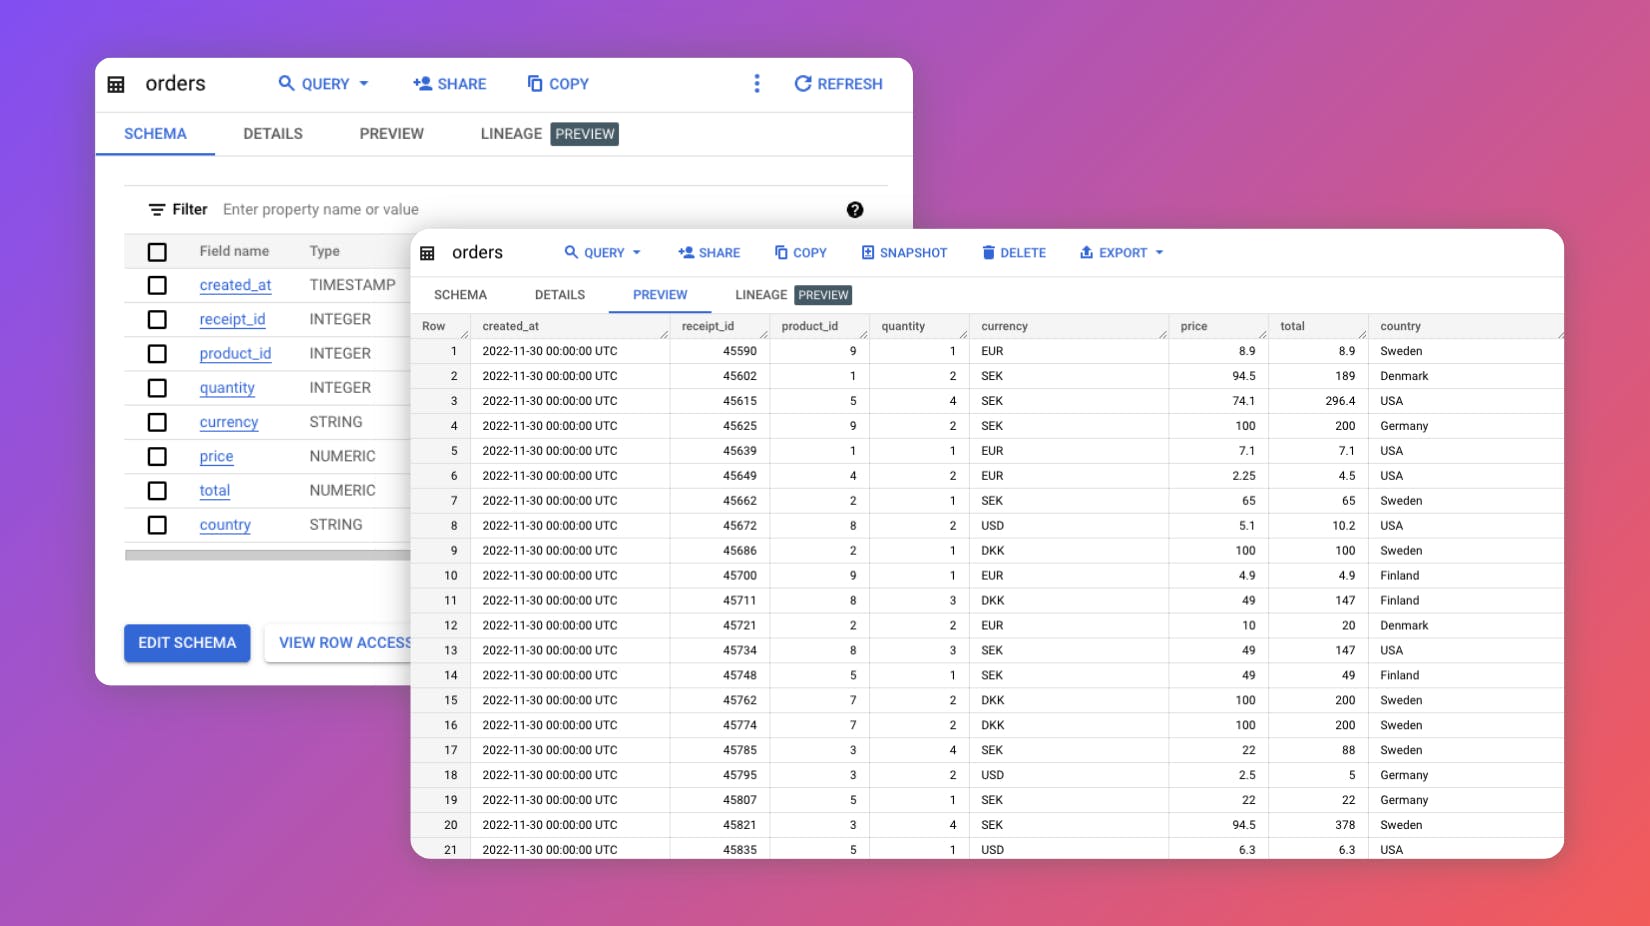
    Julia will start with their most critical dataset orders, which contains sales data for all orders made in each country’s webshop.

    The schema and dataset in BigQuery. Each table row represents a unique row on the digital receipt from a customer’s purchase. 

    The schema and dataset in BigQuery. Each table row represents a unique row on the digital receipt from a customer’s purchase. 

    Now, let’s take a look at how Julia implements Validio’s Deep Data Observability platform for this dataset, by following six steps: Connecting the data, Performing metadata validations, Configuring numerical filters, Validating aggregate numerical statistics, Validating categorical statistics, and Notifying users. 

    Configure Deep Data Observability with Validio

    1. Connect the data

    Although Validio has a CLI interface, Julia decides to use the Validator Wizard in Validio’s GUI to get started. It guides her through each step, and she’s up and running in minutes.

    Julia accesses Validio through her browser and connects to BigQuery by entering the credentials and confirming the schema, which is then automatically imported. Although Julia can easily use the Validator Wizard to set up validation for all hundreds of BigQuery tables, she decides to focus on orders for now. She knows this table is updated daily at every whole hour, so she modifies the polling interval to match. This multi-cadence functionality allows Julia to set polling intervals depending on different update schedules, as opposed to shallow Data Observability tools that only monitor data in batches once per day.

    Validio lets Julia run validators in whatever cadence is appropriate for the underlying data.

    Validio lets Julia run validators in whatever cadence is appropriate for the underlying data.

    When setting polling intervals, remember to set them to match the underlying data updates including any acceptable delays. If your data updates once every whole hour you might want to poll a few times after every hour to ensure also catching data that is updated a bit late.

    2. Perform Metadata validations

    Now, Julia wants to start with basic freshness, volume, and null value validations.

    She begins with freshness. The BigQuery table is updated with new data every hour. Julia sets up a Freshness Validator to ensure her data pipeline is running on schedule and ingestion happens at the expected cadence. Validio’s Dynamic Segmentation feature even lets her understand the freshness of each sub-segment in the dataset.

    With Dynamic Segmentation, Julia’s team is able to find financial anomalies that would otherwise remain undetected in the original dataset.

    With Dynamic Segmentation, Julia’s team is able to find financial anomalies that would otherwise remain undetected in the original dataset.

    OmniShop recently expanded to Germany and has been missing some German sales data since the launch. Thanks to Dynamic Segmentation, Julia will be able to catch any missing or late source ingestions from individual countries’ websites, like the German one.

    To the left: Julia configures the Freshness Validator. To the right: Validio’s GUI shows the data source updates at the specified cadence and instantly reveals anomalies (the red dots) that deviate from schedule.

    To the left: Julia configures the Freshness Validator. To the right: Validio’s GUI shows the data source updates at the specified cadence and instantly reveals anomalies (the red dots) that deviate from schedule.

    Next, Julia wants to look at incoming data volumes. Each batch contains around 2,000 rows. If there is a sudden drop in these numbers, Julia and her team will want to know. With this in mind, she sets up a Volume Validator. She utilizes the segmenting feature once again by country to catch suspicious decreases in row counts that can indicate issues in the different markets. Some markets have much fewer rows than others, and sudden volume changes wouldn’t be noticeable if Julia only looked at the totals.

    Dynamic Segmentation is powerful not only for its ability to detect hard-to-find anomalies—it also offers immediate root-cause analysis by pinpointing what segment a problem surfaces in.

    Julia knows OmniShop is planning to launch in more countries soon, so she uses Dynamic Thresholds (upper and lower boundaries) that will adapt as the data changes, e.g. when new segments are added. This way, she does not have to manually recreate thresholds for each market going forward—sparing her a lot of the pain from the old setup with dbt_expectations. Dynamic Thresholds take trends and seasonality into account, adjusting automatically to patterns such as higher sales volumes during weekends and holidays.

    To the left: Julia configures the Volume Validator. To the right: Validio’s GUI displays the data volume over time and detects anomalies and trends/seasonal variations using Dynamic Thresholds that adapt as the data changes.

    To the left: Julia configures the Volume Validator. To the right: Validio’s GUI displays the data volume over time and detects anomalies and trends/seasonal variations using Dynamic Thresholds that adapt as the data changes.

    Validio lets Julia get up and running in minutes because once the platform has connected to BigQuery, its algorithms immediately learn from historical data and suggest Dynamic Thresholds based on how the data has behaved over time. That is opposed to other Data Observability tools, where users must backfill and train the model with historical data for an inconveniently long time (commonly 10-14 days) after connecting to the data.

    Adding to volume and freshness, she also sets up validators for null value counts on all columns. If there are large numbers of missing values, she wants to know which areas to investigate first.

    Now that Julia has covered the basics, she wants to implement more advanced validators. The goal is to reach a state of Deep Data Observability, which includes data quality on surface level and deep into individual datapoints.

    3. Configure numerical filters

    Julia has learned that the sales dataset feeds into predictive models that require certain value types. Since data quality is a cross-functional effort, she asks the ML team for input on what validators to set up. The team lets her know that their models would incorrectly process negative values for numeric fields, resulting in inaccurate predictions or potentially failing ML pipelines.

    Validio offers an Egress feature that writes out bad data to a destination of choice. For this purpose, Julia creates a table in BigQuery specifically for debugging and root-cause analysis. She then sets up a non-negative filter with egress in Validio to identify and account for any faulty values before the predictive models consume the data. This way, she has an automated fix in place that keeps the bad data from breaking downstream pipelines.

    Julia also configures the validator to send out alerts to the ML team whenever an anomaly is found, enabling them to take action if needed (more on notifications later in the article). Julia sets up the non-negative filters for every column related to price and quantity, where negative values do not make sense but have still been historically present (due to some manual efforts to handle discounts and credits off-the-books). 

    Whenever Validio detects anomalous datapoints (the red dots) they can be automatically filtered out to a destination table for root-cause analysis.

    4. Validate aggregate numerical statistics

    With the upcoming launch in new markets, the dataset’s distribution is likely to shift. With this knowledge, Julia again discusses with the ML team to discuss their data validation needs. The ML team lets her know that distribution shifts can indeed impact the accuracy of their prediction models, and they want to know when this happens so they can retrain their models. With this in mind, Julia sets up validators for min, max, mean, standard deviation, and relative entropy that alert whenever a significant shift is found and automatically send a notification to the ML team.

    Validio will alert if the distribution of the actual data differs too much from the training data, which would inhibit the performance of the machine learning models.

    Validio will alert if the distribution of the actual data differs too much from the training data, which would inhibit the performance of the machine learning models.

    Thanks to the capability of adding a validator for multiple columns at one time, she selects the Mean Validator and applies it to all relevant numerical columns simultaneously. She repeats the process for Min, Max, Standard Deviation, and Relative Entropy Validators. 

    Validio lets Julia apply validators for multiple columns at one time, making it quick and easy to set up.

    Validio lets Julia apply validators for multiple columns at one time, making it quick and easy to set up.

    Once again, Julia leverages the segmentation feature to catch any outliers tied to specific subsegments of currency and country—she does not miss the days she had to write custom GROUP BY statements in SQL for every new subsegment she could think of to investigate.

    By doing this segmentation, Julia is able to discover price anomalies that would have otherwise remained hidden in the full dataset.

    By splitting price into currency segments, Validio detects two anomalies in the DKK segment while the same datapoints are considered normal range values in the complete set. Julia investigates the datapoints and discovers they were attributed incorrect currencies.

    By splitting price into currency segments, Validio detects two anomalies in the DKK segment while the same datapoints are considered normal range values in the complete set. Julia investigates the datapoints and discovers they were attributed incorrect currencies.

    5. Validate categorical statistics

    Another problem that has plagued Julia’s team lately is manual data entry errors, often resulting in broken pipelines. OmniShop’s customer support team sometimes has to enter orders manually when there was a system failure, but the customer still received a confirmation email.

    To catch these types of wrongful entries, like duplicate values or unexpected new elements, Julia sets up a Cardinality Monitor in Validio. She does this specifically for the string columns country and currency, where human errors are more likely to happen. 

    OmniShop’s markets include Sweden, Finland, Denmark, Germany, and USA. That means the country column has a cardinality of five. If someone enters anything other than these five countries, the cardinality increases, and the validator will detect an anomaly. Should someone enter “U.S.A.” instead of “USA”, that might cause a downstream issue, and Julia’s team will now know before that happens.

    Categorical Validators like this one let Julia identify anomalies, including manual data entry errors or unexpected distributions of values. 

    6. Notify users & manage issues

    Julia and her team members are often contacted by various teams across the organization that get impacted by data issues. The ML team who owns the downstream predictive models is particularly frequent in Julia’s Slack DMs whenever their models fail due to bad data.

    With Validio, the ML team and all other stakeholders at OmniShop have the option to subscribe to notifications and specify the level of detail they should contain. This way, Julia and her team can be certain all teams that depend on this data will be notified as soon as something looks off.

    Validio integrates with several collaboration tools. Julia sets up notifications to be sent via Slack and email.

    Validio integrates with several collaboration tools. Julia sets up notifications to be sent via Slack and email.

    However, Julia has first-hand experience with how alert fatigue can be dangerous when critical errors are accidentally ignored. This is where Validio’s Criticality Triage comes into place: Users can edit thresholds, as well as resolve or ignore issues, depending on how critical they are. For some issues, Julia may want to manually edit the thresholds to include or exclude certain datapoints.

    In this case, Validio detects an error that Julia wants to ask the ML team about. Julia can then easily share the issue with the ML team in Slack directly from Validio’s interface. If the team knows the issue will require some time to resolve, Julia can choose to mute recurring notifications—sparing the ML team from alert fatigue. In case the error was actually expected and not considered an anomaly, Julia can instead mark it as resolved. Validio’s models would then take that parameter into account, improving future accuracy.

    Julia and the broader team can also create Jira tickets directly from alerts in Validio’s interface, in case an anomaly needs further involvement.

    Validio lets users create tickets in their issue management tool and provide feedback on the criticality of alerts to improve future accuracy.

    Validio lets users create tickets in their issue management tool and provide feedback on the criticality of alerts to improve future accuracy.

    What’s next?

    Julia has now successfully implemented a Deep Data Observability platform to monitor and validate OmniShop’s most important order data in BigQuery. By using Validio’s Validator Wizard she was able to configure the setup in less than five minutes while receiving automatic suggestions of what validations and dynamic thresholds to use for the data. 

    OmniShop can now move on to apply the same setup for all relevant datasets to scale the process. And maybe most importantly, they will be able to use Validio for Deep Data Observability throughout all their pipelines—in data warehouses, object storage, and data streams alike.

    Seeing is believing

    Get a personalized demo of how to reach Deep Data Observability with Validio.