Data Trends & Insights

What is Deep Data Observability?

Thursday, Feb 23, 20237 min read
Patrik Liu Tran

This article is based on the report “The data leader’s guide to Deep Data Observability”— make sure to check out the full report for more details. 

Tl;dr

We distinguish between “Shallow” Data Observability and “Deep” Data Observability, and data leaders should aim for the latter in order to get full confidence in their data. 

This text explains why Deep Data Observability is different from Shallow: Deep Data Observability is truly comprehensive in terms of data sources, data formats, data granularity, validator configuration, cadence, and user focus.

The need for “Deep” Data Observability

2022 was the year when Data Observability really took off as a category (as opposed to old-school “data quality tools”), with the official Gartner terminology for the space. Similarly, Matt Turck consolidated the Data Quality and Data Observability categories in the 2023 MAD Landscape analysis. Nevertheless, the industry is nowhere near fully formed. In his 2023 report titled “Data Observability—the rise of the data guardians”, Oyvind Bjerke at MMC Ventures discusses the space as having massive amounts of untapped potential for further innovation. 

With the backdrop of this dynamic space, we go ahead and define Data Observability as:

The degree to which an organization has visibility into its data pipelines. A high degree of Data Observability enables data teams to improve data quality. 

However, not all Data Observability platforms, i.e. tools specifically designed to help organizations reach Data Observability, are created equal. The tools differ in terms of the degree of Data Observability they can help data-driven teams achieve. We thus distinguish between Deep Data Observability and Shallow Data Observability. They differ on the following dimensions: Data sources, data formats, data granularity, validator configuration, validator cadence, and user focus.

In the rest of this article, we dive deep into Deep Data Observability and explain the six dimensions that distinguish “Deep” Data Observability from “Shallow” Data Observability.

The six dimensions used to distinguish Shallow Data Observability from Deep Data Observability.

The six dimensions used to distinguish Shallow Data Observability from Deep Data Observability.

The six pillars of Deep Data Observability

Data sources: Truly end-to-end

Shallow Data Observability solutions tend to focus only on the data warehouse through SQL queries. Deep Data Observability solutions on the other hand, provide data teams with equal degrees of Observability across data streams, data lakes, and data warehouses. There are two reasons why this is important:

First, data does not magically appear in the data warehouse. It often comes through a streaming source and lands in a data lake, before it gets pushed to the data warehouse. Bad data can appear anywhere along the way, and you want to identify issues as soon as possible and pinpoint their origin. 

Secondly, in an increasing amount of data use cases such as machine learning and automated decision making, data never touches the data warehouse. For a Data Observability tool to be proactive and future-proof, it needs to be truly end-to-end, also in lakes and streams.

Data formats: structured & semi-structured

Data streams and lakes segue nicely into the next section: data formats. Shallow Data Observability is focused on the data warehouse, meaning it obtains observability for structured data. However, to reach a high degree of Data Observability end-to-end in your data stack, the Data Observability solution must support data formats that are common in data streams and lakes (and increasingly warehouses). With Deep Data Observability, data teams can obtain high-quality data by monitoring data quality not only in structured datasets, but also for semi-structured data in nested formats, e.g. JSON blobs.

Data granularity: Univariate & multivariate validation of individual datapoints and aggregate data

Shallow Data Observability originally rose to fame based on analyzing one-dimensional (univariate) statistics about aggregate data (e.g. metadata). For example, looking at the average number of null values in one column.

However, countless cases of bad data have told us that data teams need to validate not only summary statistics and distributions, but also individual datapoints. In addition, they need to look at dependencies (multivariate) between fields (or columns), and not just individual fields—real world data does come with dependencies so most data quality problems are multivariate in nature. Deep Data Observability helps data-driven teams do exactly this: both univariate and multivariate validation of individual datapoints as well as aggregated data. Let’s have a look at an example of when multivariate validation is needed.

The dataset below is segmented on country and on product_type (multiple variables, not just one) which is necessary in order to validate each individual subsegment (set of records). Each subsegment is likely to have unique volume, freshness, anomalies, and distribution, which means it must be validated individually. Let’s say this dataset tracks all transaction data from an e-comm business. Then each country is likely to display individual purchasing behaviors, which means they need to be validated individually. Double-clicking one more time, we might also find that within each country each product_type is subject to different purchasing behaviors too. Thus, we need to segment on both columns to truly validate the data. 

Segmentation based on more than one variable is an example of mulitvariate validation provided in a Deep Data Observability platform.

Segmentation based on more than one variable is an example of mulitvariate validation provided in a Deep Data Observability platform.

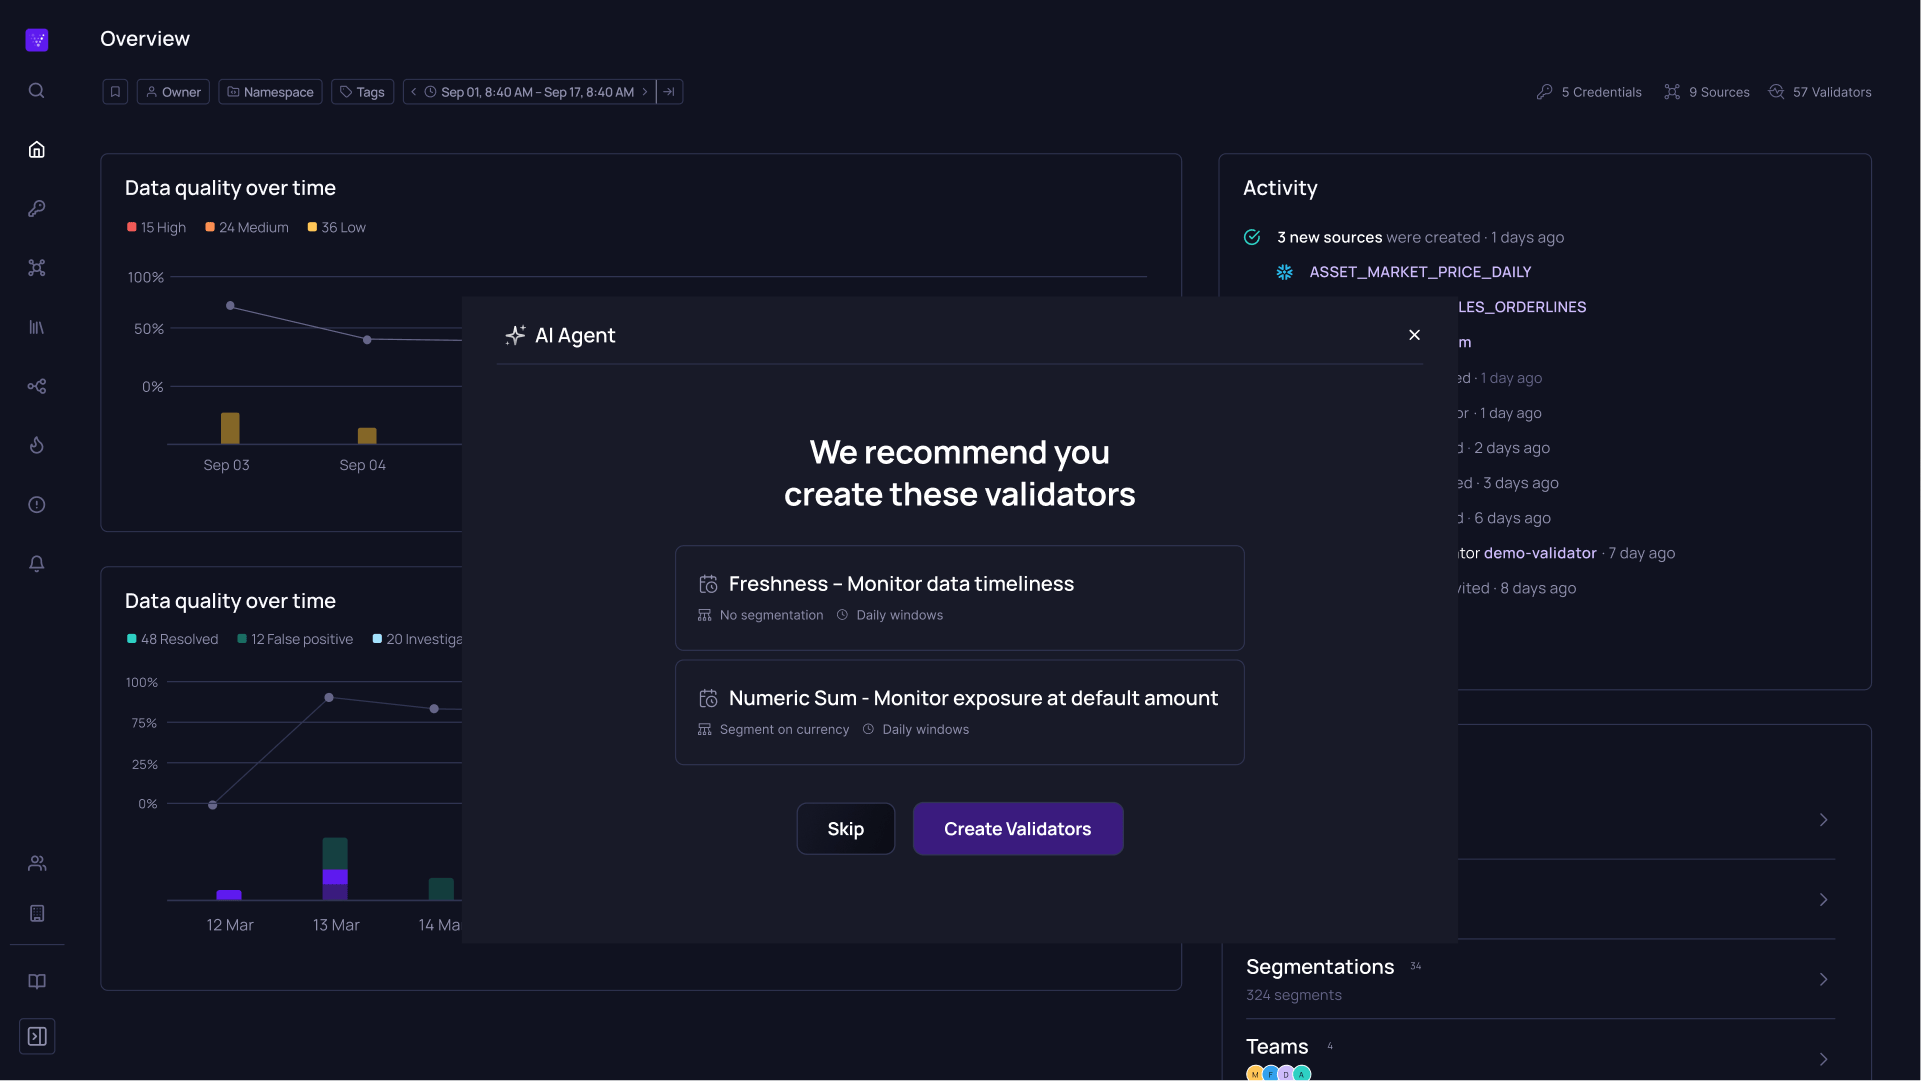
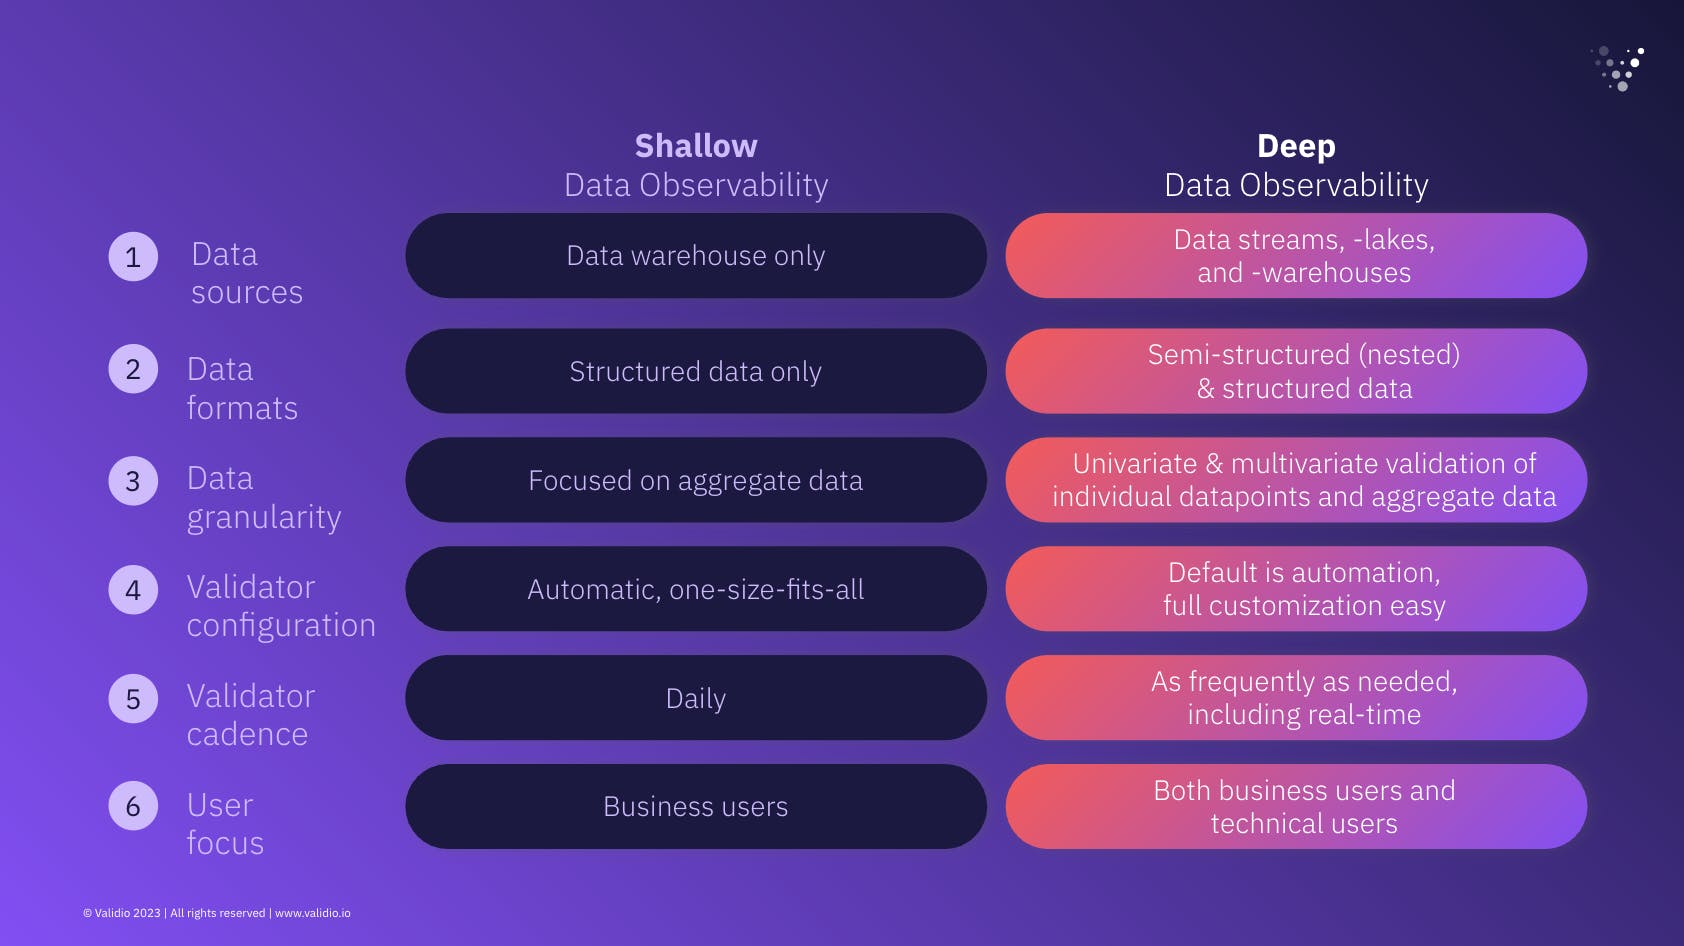
Validator configuration: Automatically suggested as well as manually configured

Depending on your organization, you might be looking for various degrees of scalability in your data systems. If you’re looking for a “set it and forget it” type of solution that alerts you whenever something out of the ordinary happens, then Shallow Data Observability is what you’re after; you will get a bird’s eye view of e.g. all tables in your data warehouse and whether they behave as expected. 

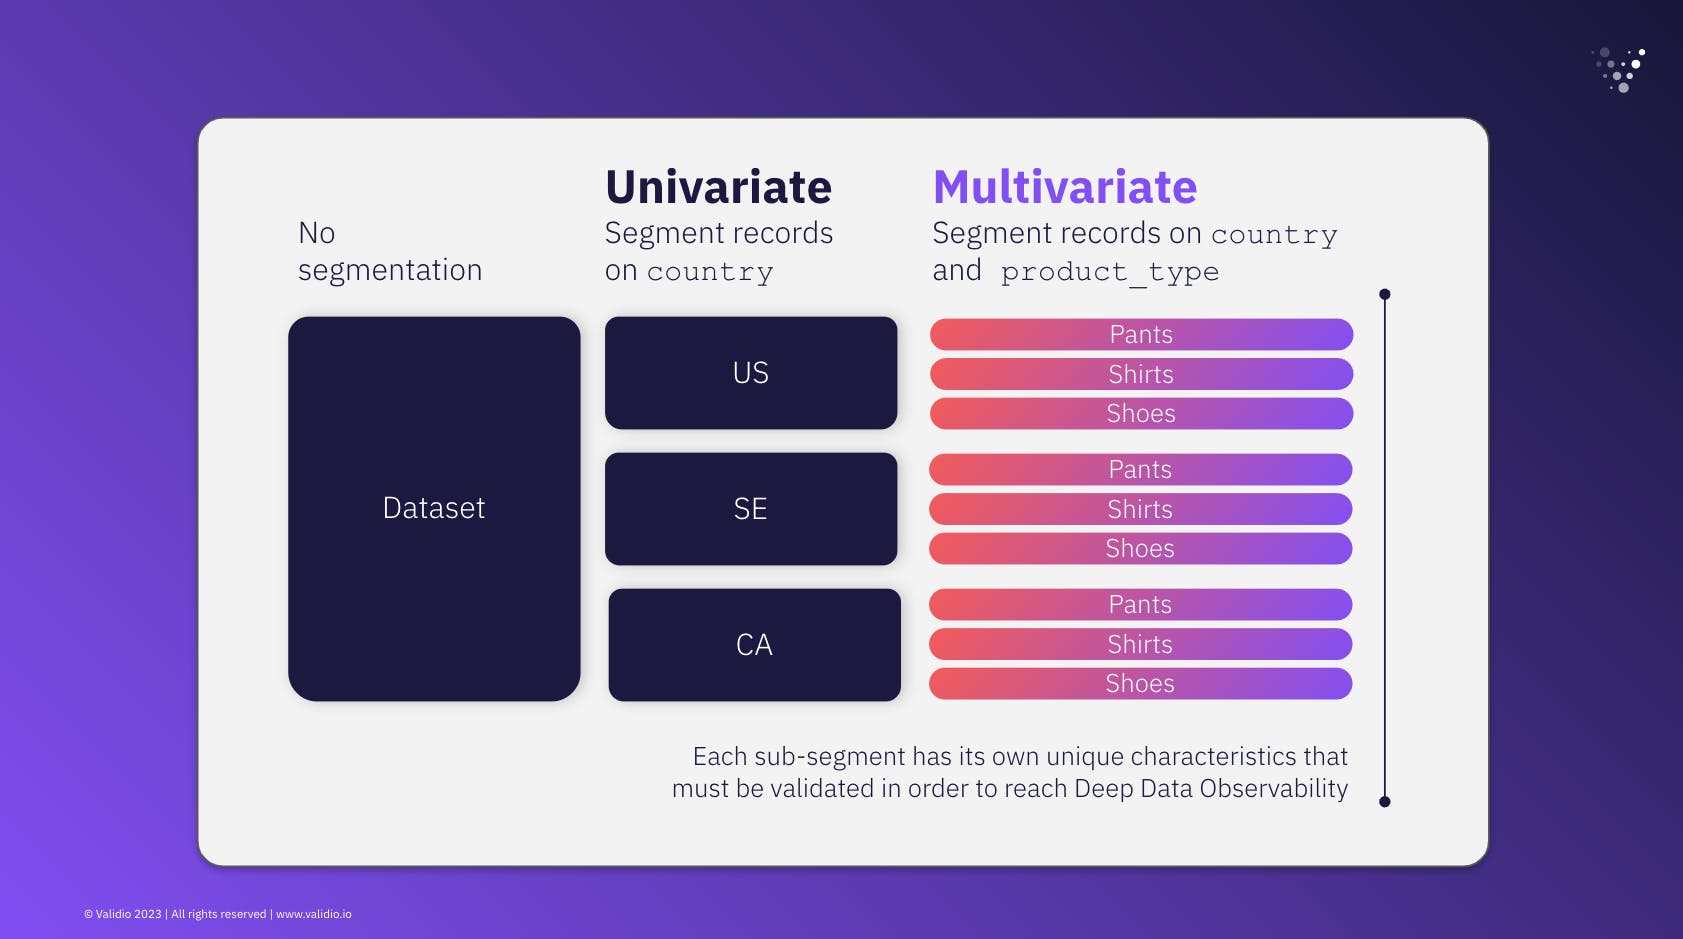
Conversely, your business might have unique business logic, or custom validation rules you’ll want to set up. The degree to which you’re able to do this custom setup in a scalable way determines the degree to which you have Deep Data Observability. If each custom rule requires a data engineer to write SQL, you’re looking at a not-so-scalable setup, and it will be very challenging to reach the state of Deep Data Observability. Instead, if you have a quick-to-implement menu of validators that can be combined in a tailored way to suit your business, then Deep Data Observability is within reach. Setting up customized validators should not be reserved for code-savvy data team members only.

Multi-cadence validation: As frequently as needed, including real-time

Again, depending on your business needs, you might have different requirements for Data Observability on various time horizons. If you use a standard type of setup where data is loaded into your warehouse every day, then Shallow Data Observability, which only supports a standard daily cadence, fulfills your needs. 

Instead, if your data infrastructure is more complex with some sources being updated in real-time, some daily, and others less frequently, you will need support to validate data with all of these cadences. This multi-cadence need  is especially true for companies relying on any kind of data for rapid decision making or real-time product features, e.g. dynamic pricing, any IoT-applications, retail businesses who rely heavily on digital marketing, etc. A Deep Data Observability platform has full support for validating data for all these use cases. It ensures that you get insights into your data at the right time according to your business context. It also means that you can act on bad data right when it occurs, and before it hits your downstream use cases.

User focus: both technical and non-technical

Data quality is an inherently cross-functional problem, which is part of the reason why it can be so challenging to solve. The person who knows what “good” data looks like in a CRM dataset might be a sales person with their boots on the ground in sales calls. Thus, the person that moves (or ingests) data from the CRM system into the data warehouse might have no insight into this at all, and might naturally be more concerned with whether the data pipelines ran as scheduled.

Shallow Data Observability solutions primarily cater to one single user group. They either focus on the data engineer, who cares mostly about the nuts and bolts of the pipelines and whether the system scales. Or, they focus on the business users, who might care mostly about dashboards and summary statistics.

Deep Data Observability is obtained when both types of users are kept in mind. In practice, this means providing multiple modes of controlling a Data Observability platform: through a command line interface and through a graphical user interface. It might also entail multiple access levels and privileges. In this way, all users can collaborate on configuring data validation, and obtain a high degree of visibility into data pipelines. This in turn effectively democratizes data quality within the whole business.

What’s next

We’ve now covered the six dimensions differentiating Shallow and Deep Data Observability. Our hope is that this report gives you two frameworks to rely on when evaluating your business needs for data quality and Data Observability tooling.

If you have comments or questions about this article, don't hesitate to contact us at hello@validio.io—data quality is our favorite topic.

You can also request a demo below to discover how Validio can help your organization reach Deep Data Observability.

Curious?

Find out how Validio can help you with Deep Data Observability today