TL;DR
Deep Data Observability means the ability to monitor data everywhere and in any storage format. In this article, we explain how you can use Validio to monitor a Kinesis Stream and catch data issues inside JSON events. We walk you through how to:
Streaming and Deep Data Observability
There are many industry use cases for leveraging streaming data. To name a few, financial institutions can detect fraud faster, and healthcare providers can monitor patients remotely in real-time. Media platforms can process terabytes of daily logs, while retailers can manage inventory and stock replenishment faster.
When it comes to streaming solutions, Amazon Kinesis is one of the most popular ones. It’s scalable, has built-in fault tolerance, and doesn’t require any infrastructure management.
Data streams most commonly process JSON data since it’s lightweight and easy to parse. However, the semi-structured format of JSON comes with data quality challenges (Matt Weingarten, Senior Data Engineer at Disney, does a great job explaining why in Data Observability For Semi-structured Data). The difficulty of validating semi-structured data may also explain why most data quality solutions focus on only validating structured data (such as data warehouses with neatly organized tables and columns).
Deep Data Observability, on the other hand, means the ability to monitor data in any format and any location. For organizations using data streams, that data is likely processed in a semi-structured format. By being proactive and making sure you can validate that data, you can catch anomalies before they have a chance to spread across your data environment and impact your business exponentially worse.
So in this article, we'll walk through setting up Validio’s Deep Data Observability platform to monitor data quality in a Kinesis Stream.
A business scenario for streaming data
To illustrate Validio’s capabilities for validating data in Kinesis, we use a common real-time analytics scenario.
OmniShop, a fictional e-commerce company, has a data team of four Data Engineers. They manage the streaming of customer engagement data from the webshop to visualization dashboards in Tableau. An analytics team then uses these dashboards to draw insights that can improve OmniShop’s business.
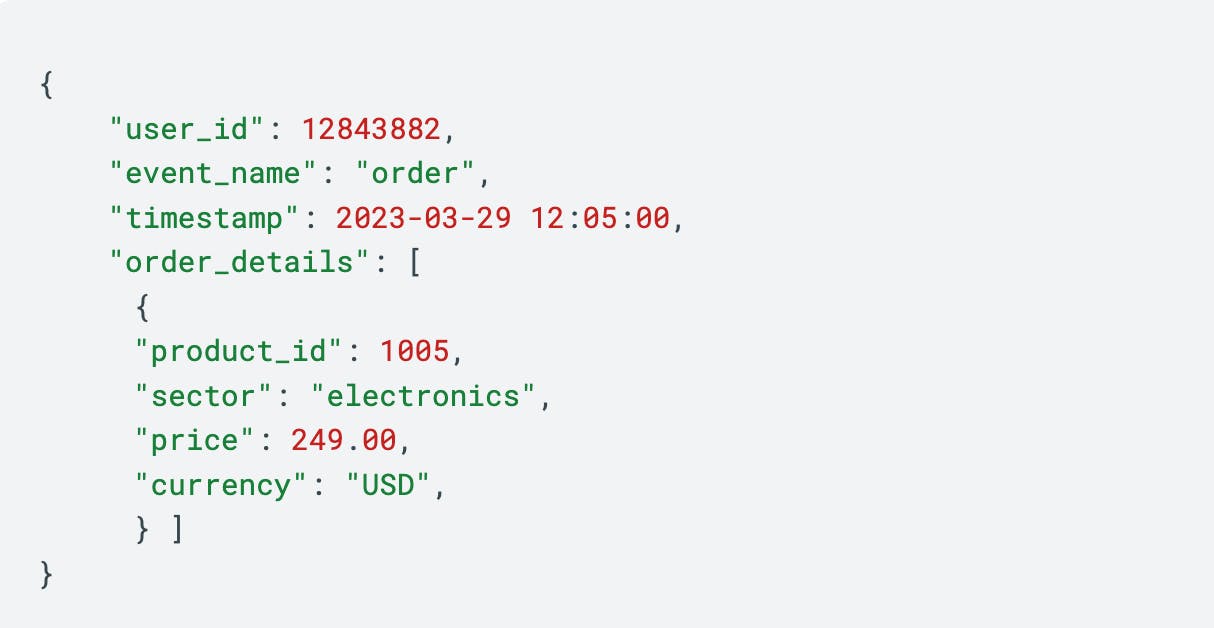
The team uses Amplitude, a digital analytics platform, to collect event data in JSON format and stream it into Kinesis. Here’s a stripped-down example of what an event can look like:
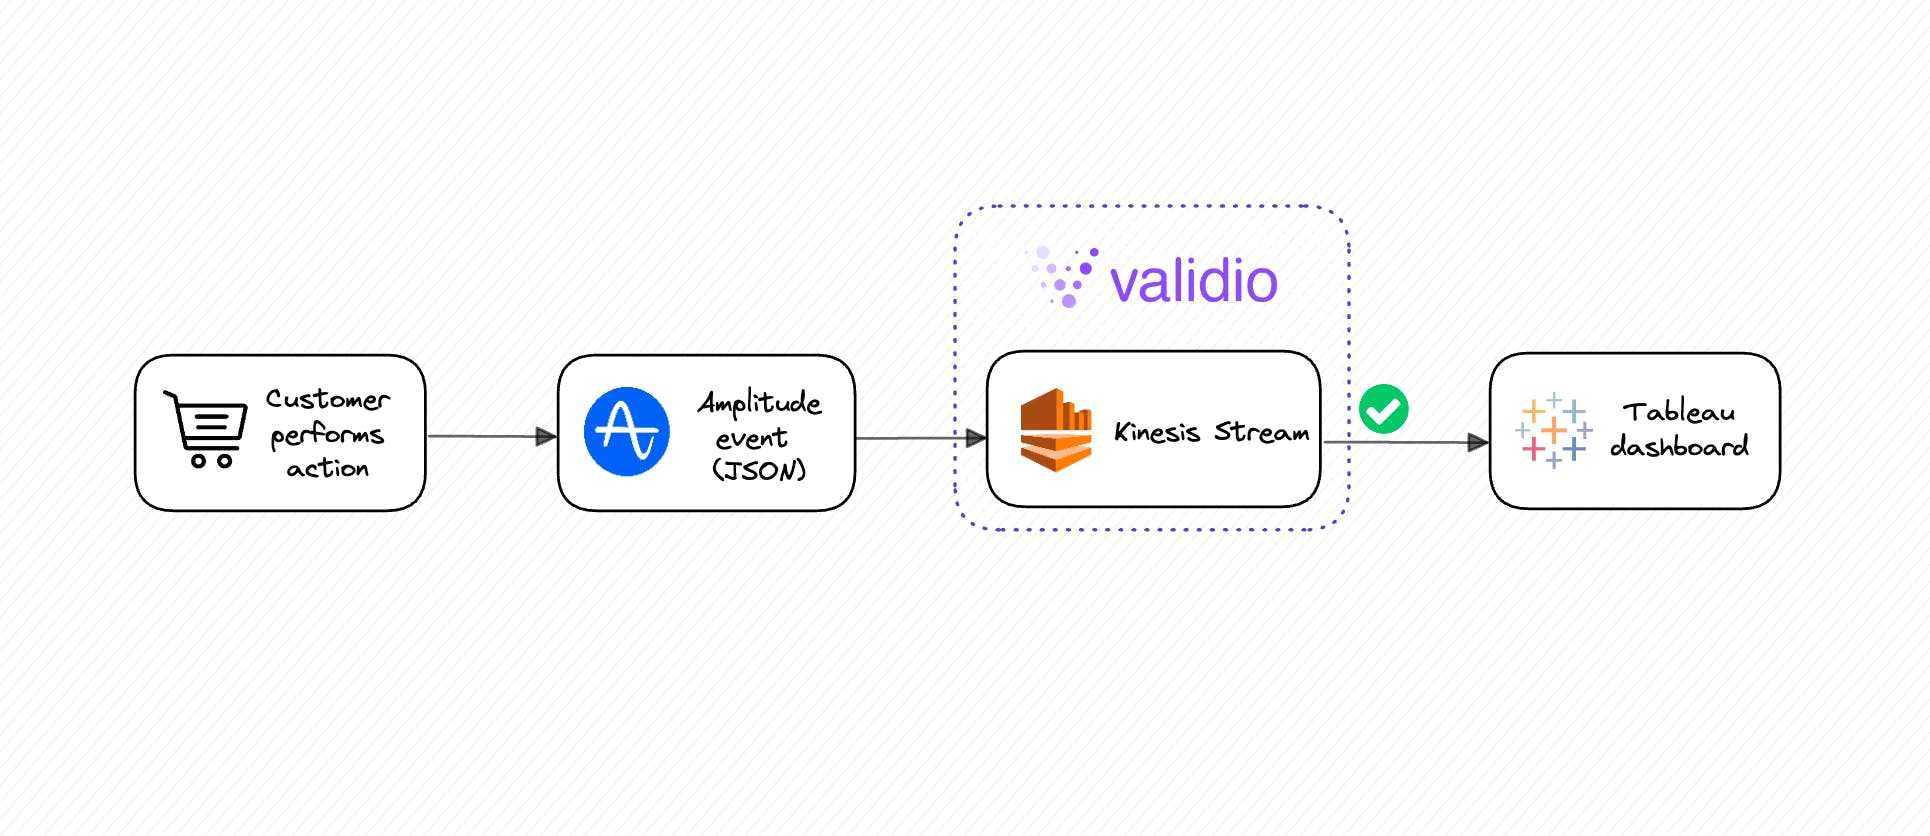
All of the events go through the Kinesis stream, named Customer Engagement Stream, and land in visualization dashboards in Tableau. By analyzing this data, OmniShop can gain immediate insight into how customers interact with their webshop and track changes in pricing and product availability.
Here’s what the data flow looks like:
Currently, the data team has been plagued by silent errors causing the Tableau dashboards to display incorrect data without them knowing. This has led to costly mistakes like wrongly forecasting inventory needs, and miscalculated sales projections.
But even when they do notice apparent anomalies, they don’t know what caused the errors. This is why they have decided to implement a Deep Data Observability platform. They want automated detection of data issues as soon as they appear in Kinesis, and root-cause analysis to pinpoint the origin of the issues.
One of the data engineers, Emma, will set up Validio for Kinesis. Let’s see how she does this in six steps:
Set up Deep Data Observability for a Kinesis Stream:
1. Connect to Kinesis
Emma decides to use the Validator Wizard in Validio’s GUI to get started. It will guide her through each step and have her system up and running in minutes.
First off, she accesses Validio through her browser and connects to Kinesis by entering her credentials. This automatically fetches the JSON data from Kinesis and splits it into fields based on its key-value pairs.
Then, she selects a window to validate the data on. That means the time range over which to calculate metrics. For this use case, Emma sets up a tumbling window (regular and non-overlapping time periods) to look at the data in 5-minute chunks.
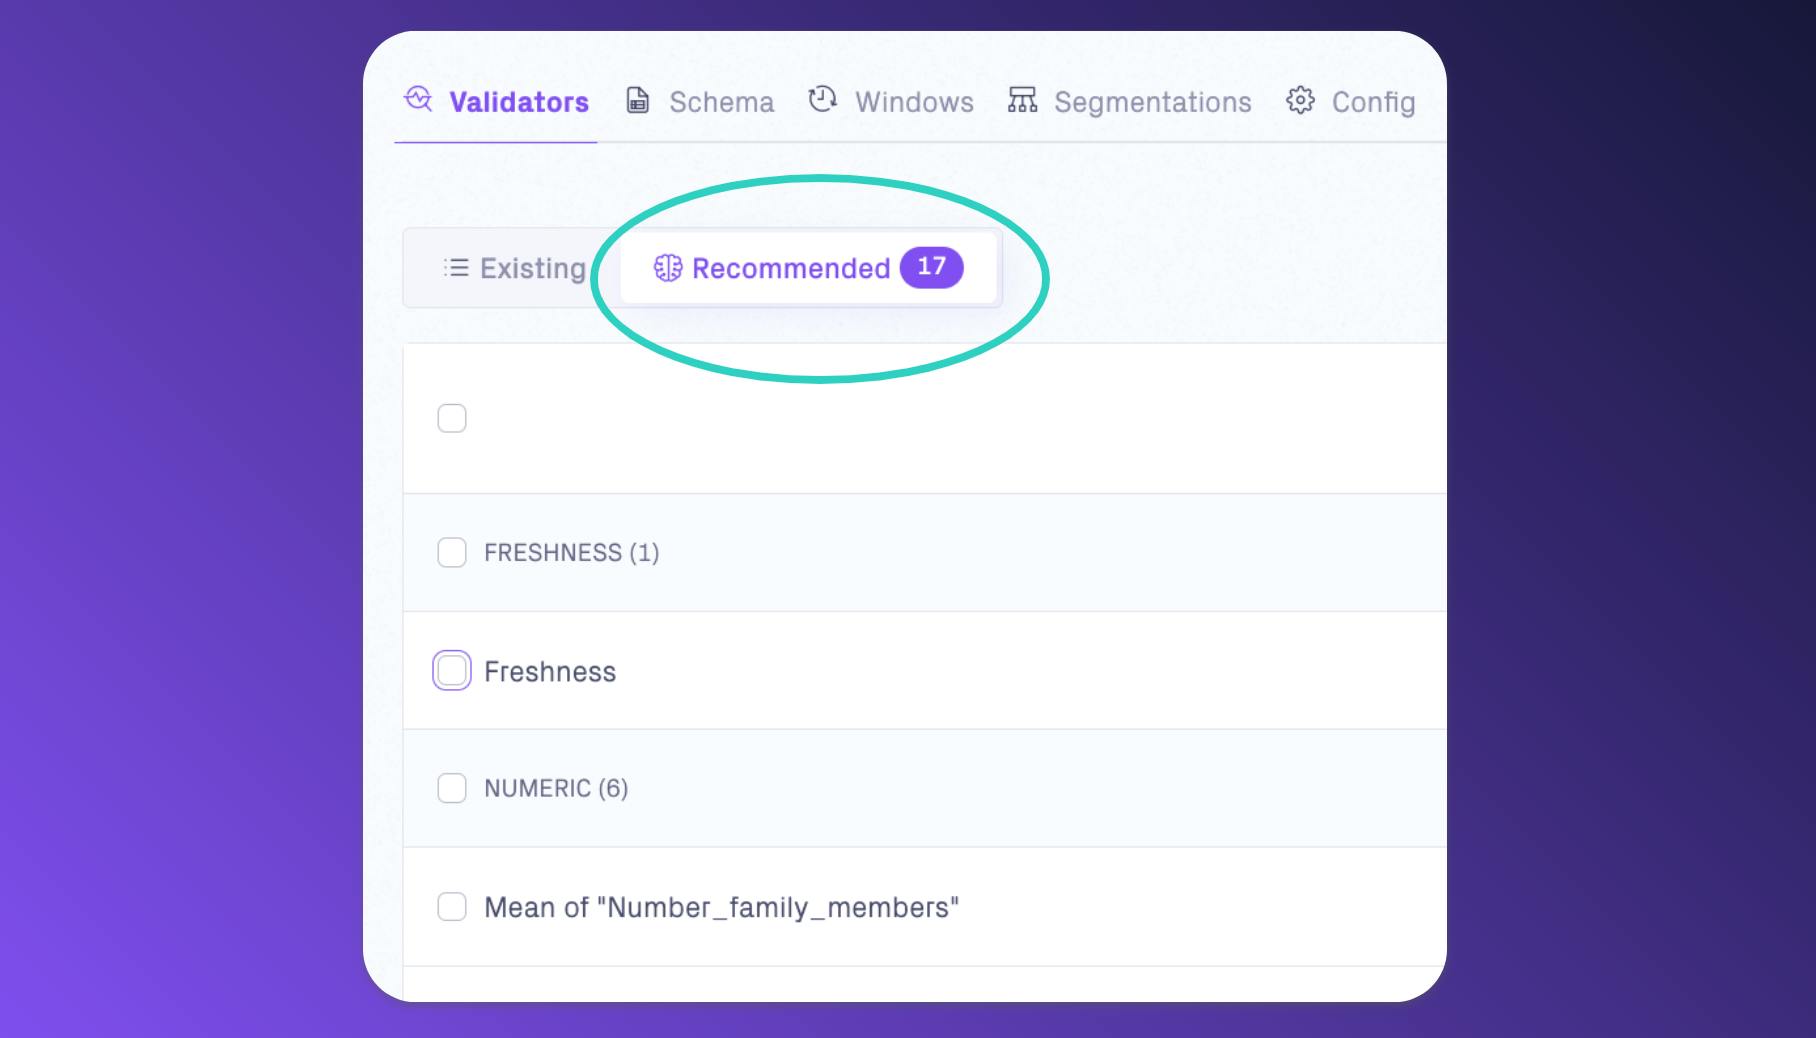
Once connected, Validio’s platform analyzes the data in Kinesis and recommends a number of validators to quickly and easily receive data quality coverage.
2. Validate your metadata
Now that the initial setup is complete, Emma wants to set up validators that look at metadata fundamentals like freshness and volume.
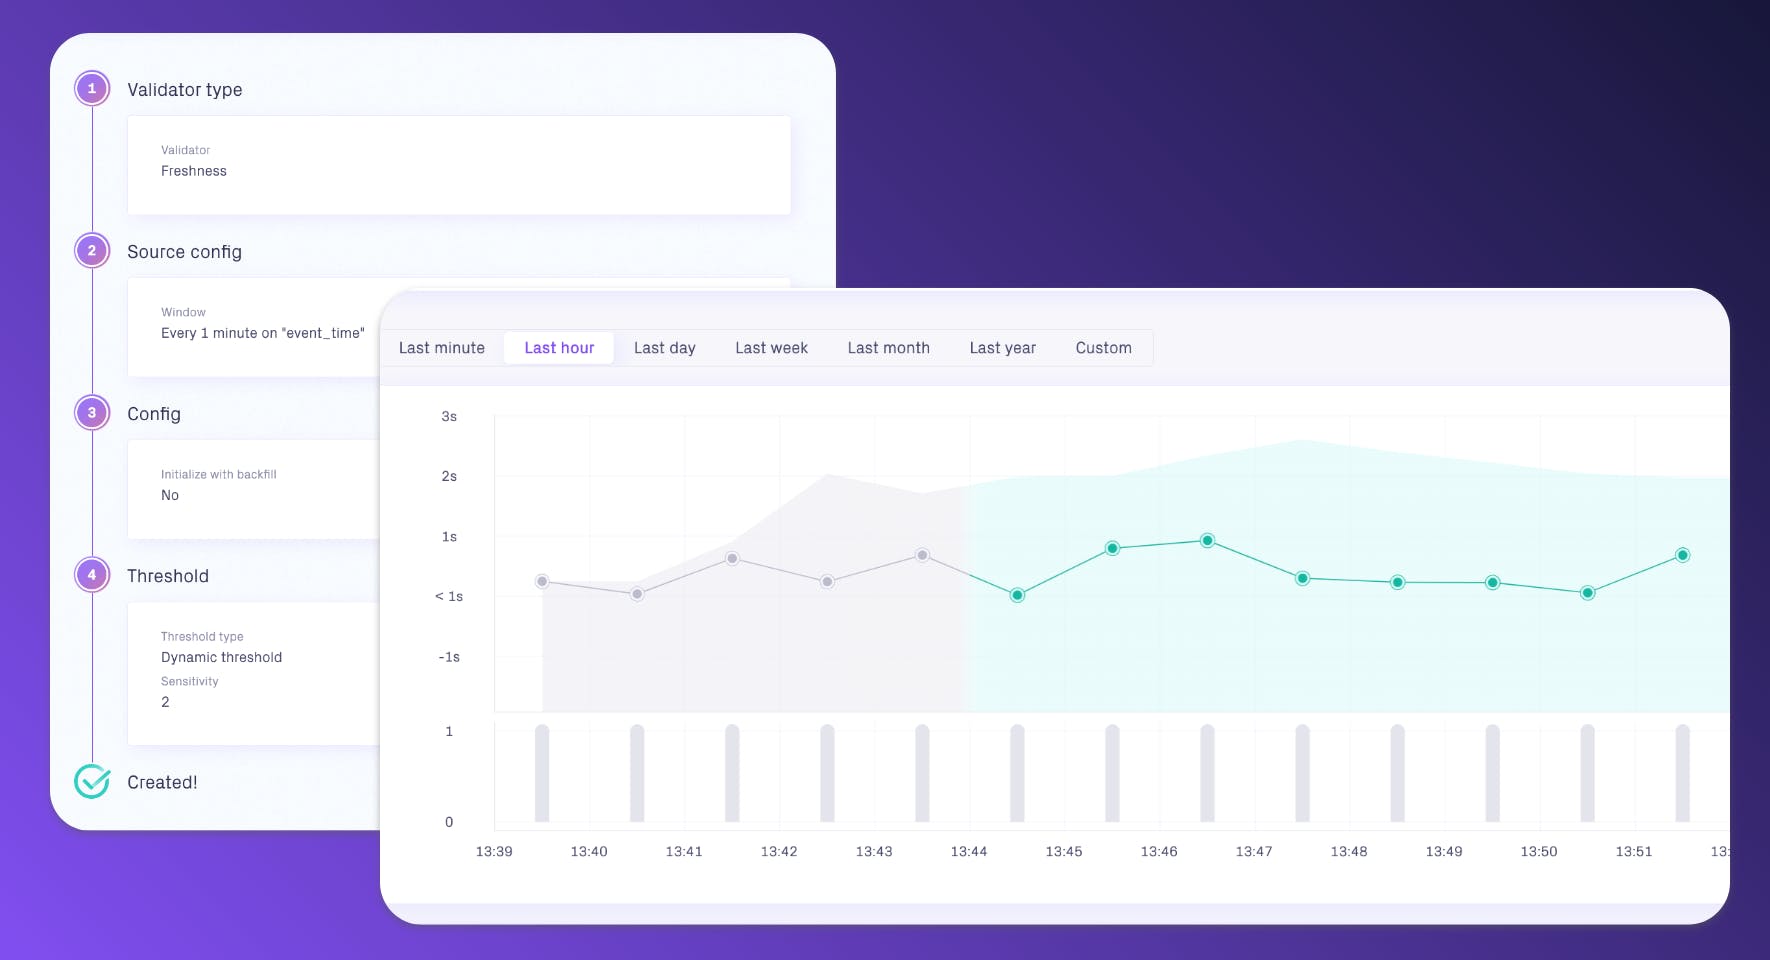
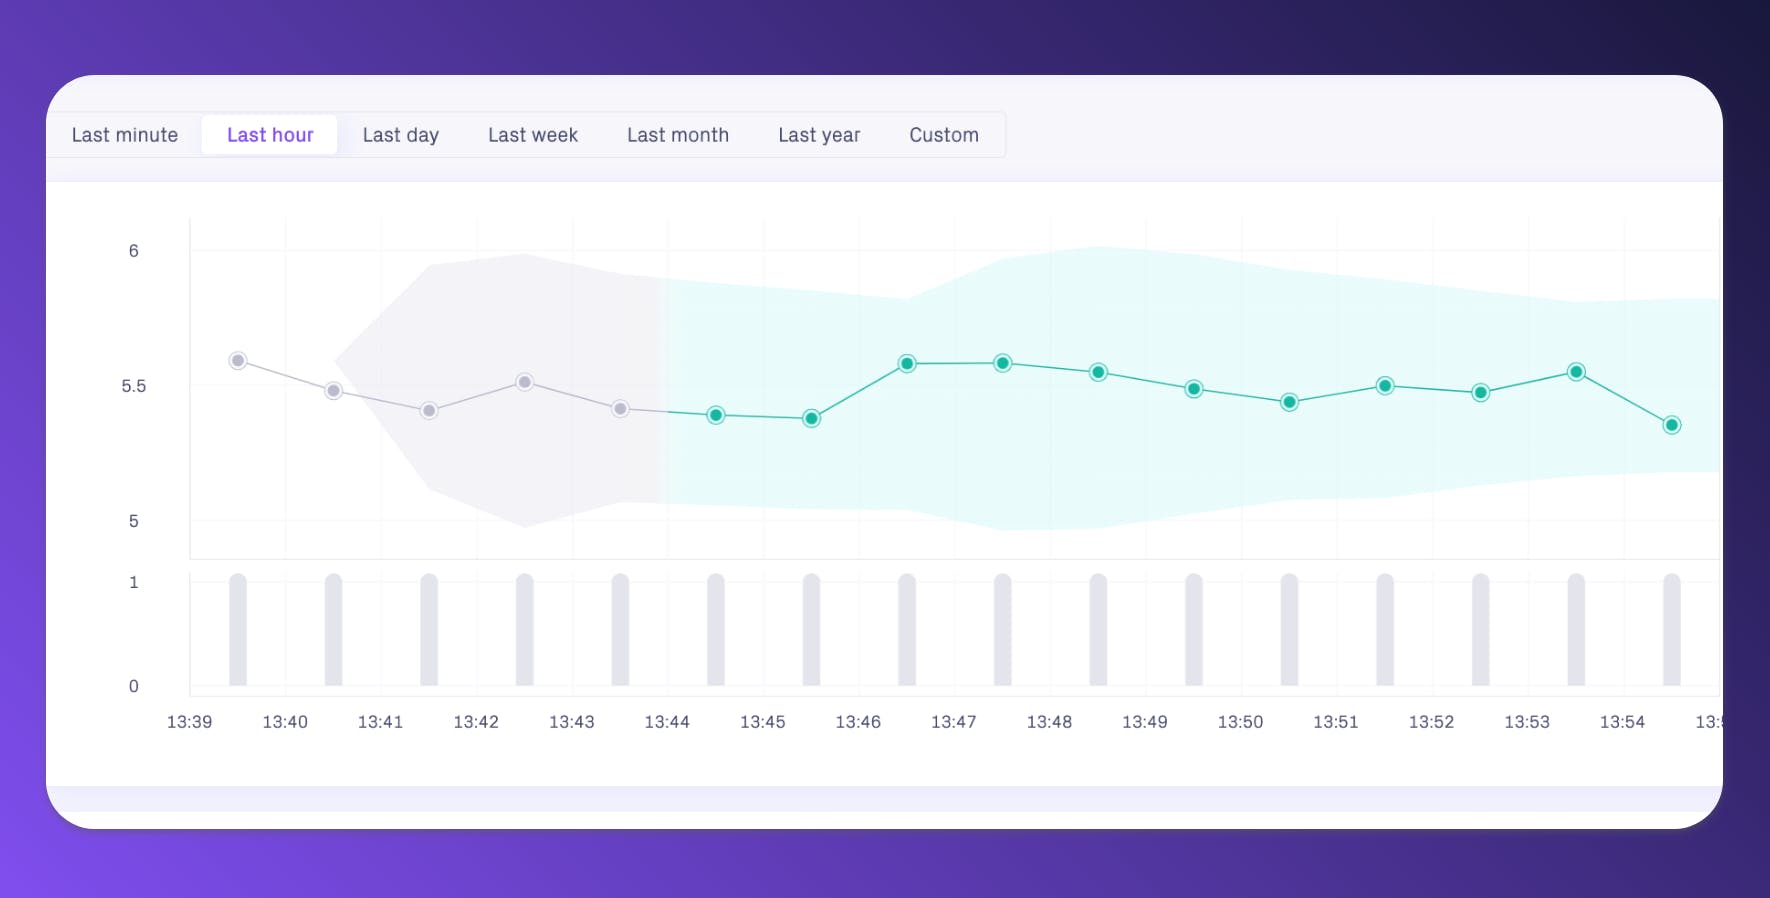
She starts by setting up a Freshness Validator that checks if the stream picks up data every minute as scheduled. If anything disrupts this cadence of data collection, Emma will know immediately.
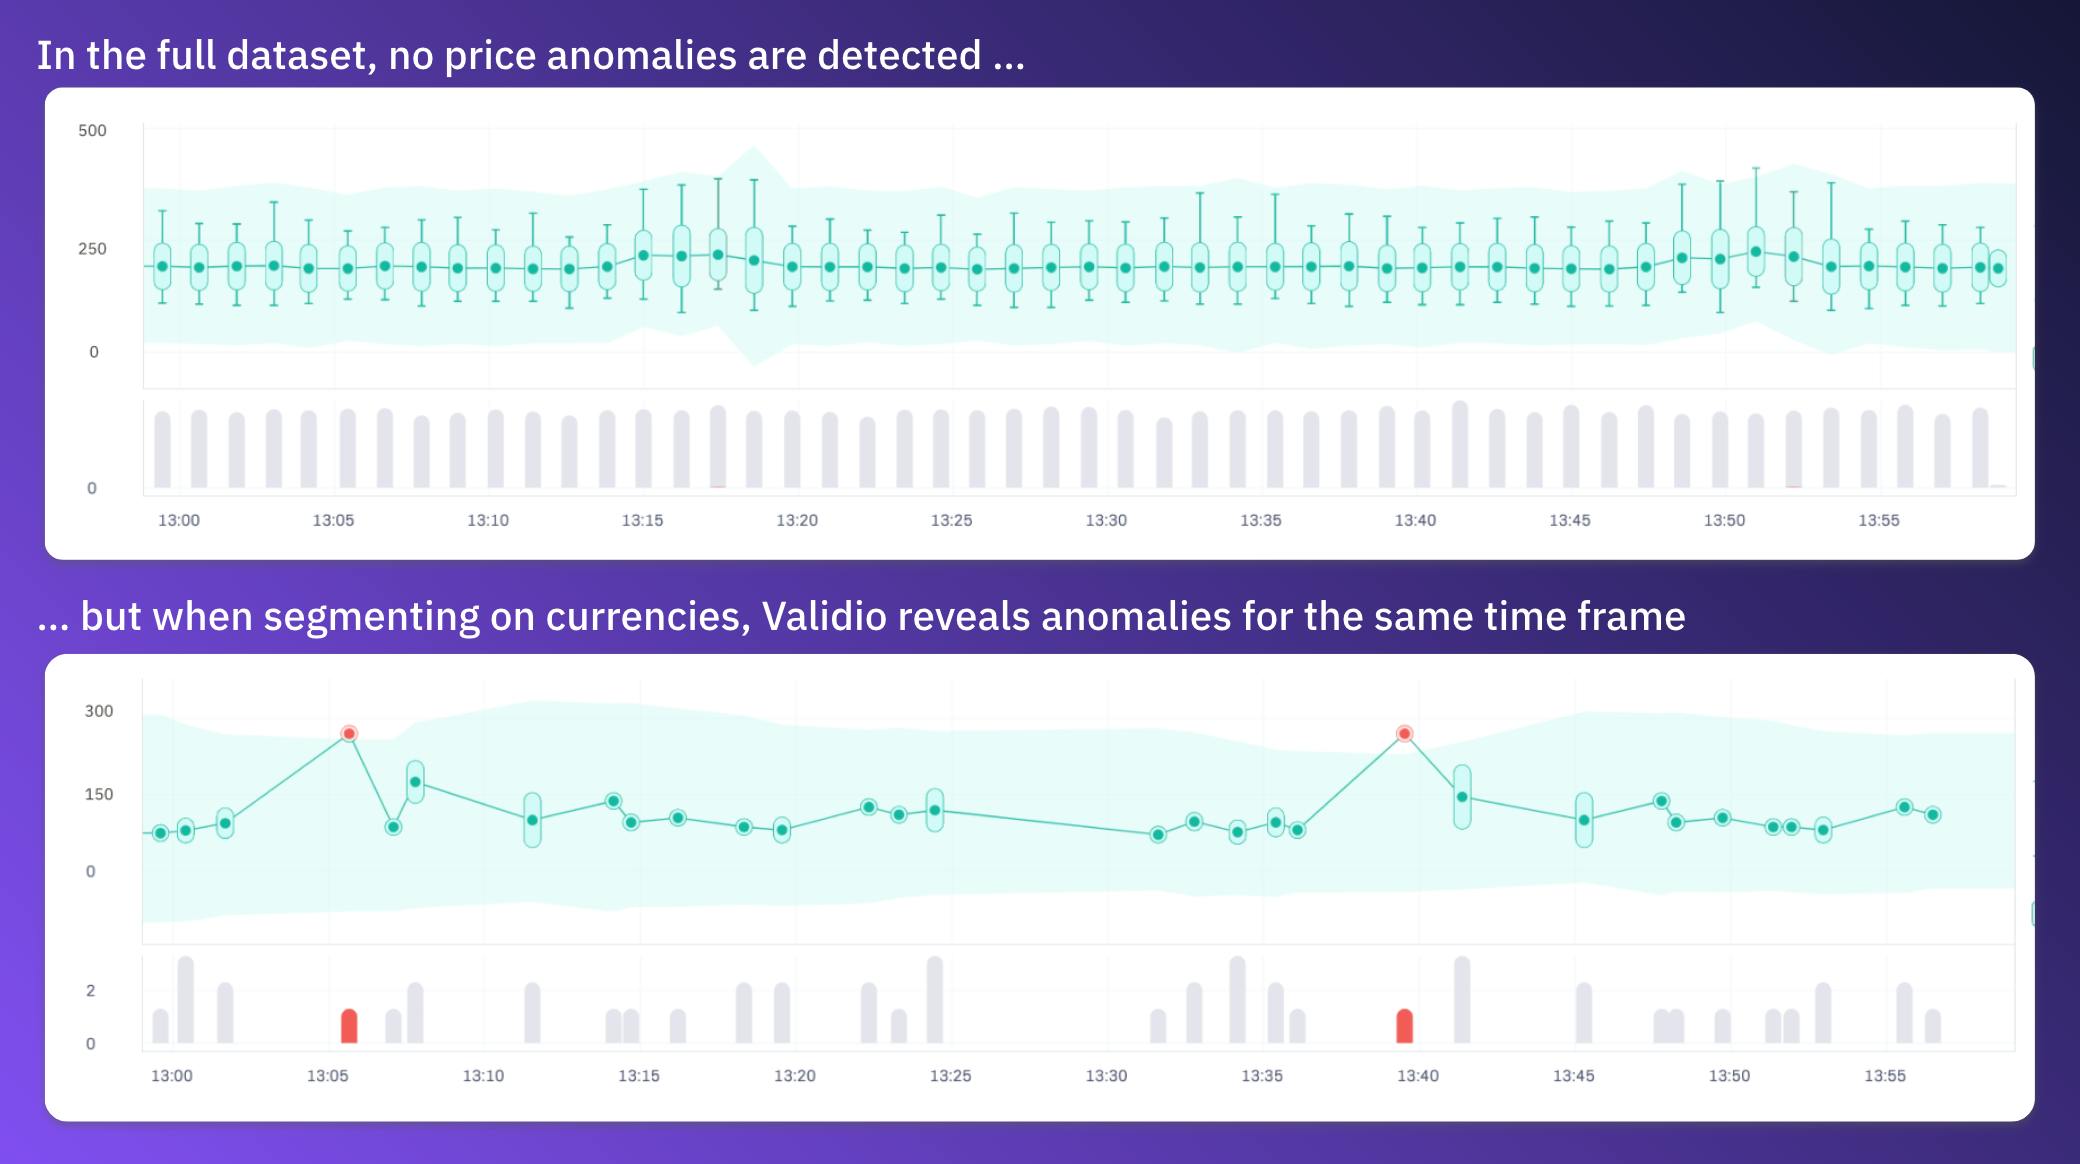
Validio also lets her detect issues deep within segments of the data. For example, if events related to a specific product_id would stop coming in, while the overall data stream is on schedule, that would indicate there is an error related to that product. As such, the Dynamic Segmentation feature is a valuable tool for root-cause analysis.
She moves on to Volume Validation. The volume of events in the stream depends on the time of day and seasonality. OmniShops has a lot more active customers during evenings and holidays, so Emma needs the validators to take this pattern into account. To do that, she uses Dynamic Thresholds, which automatically adjust depending on historical patterns in the data. This way, she doesn’t have to manually maintain the thresholds when the underlying data changes (if the webshop’s customer base grows, for example).
3. Configure Aggregate Numerical Validators
Validio’s Dynamic Segmentation reveals anomalies that may be hidden in smaller segments of the data. In this case, segments represents JSON keys such as product_id, section, price, and currency, as shown below:
Emma makes use of this to quality-check the pricing for all products. Sometimes, products are incorrectly priced in a specific currency, while the overall price range looks normal. By setting up Aggregate Numerical Validators (metrics like mean/max/min/std dev) for price while using Dynamic Segmentation on currency, Emma’s validators will pick up row-level anomalies immediately.
4. Validate Categorical Distribution
A Categorical Validator will pick up on any unexpected elements that are added or removed from a field, such as misspelled or renamed strings. For this use case, Emma sets up a validator to alert if new values appear in section.
OmniShop sells a limited number of product categories, but once in a while they launch new categories or rename existing ones. In those cases, it’s important that the Tableau dashboards are modified to include new categories. Other than catching incorrect manual data entries, this setup also lets Emma know as soon as the dashboards need updating.
5. Notify users & manage issues
Data observability is not just about catching bad data, but also about making sure the right teams get informed at the right time.
OmniShop uses Slack for communications and Jira for issue management. Validio integrates with both these tools directly from the GUI, making it easy for Emma’s team to collaborate with others at OmniShop and track the progress of ongoing data issues.
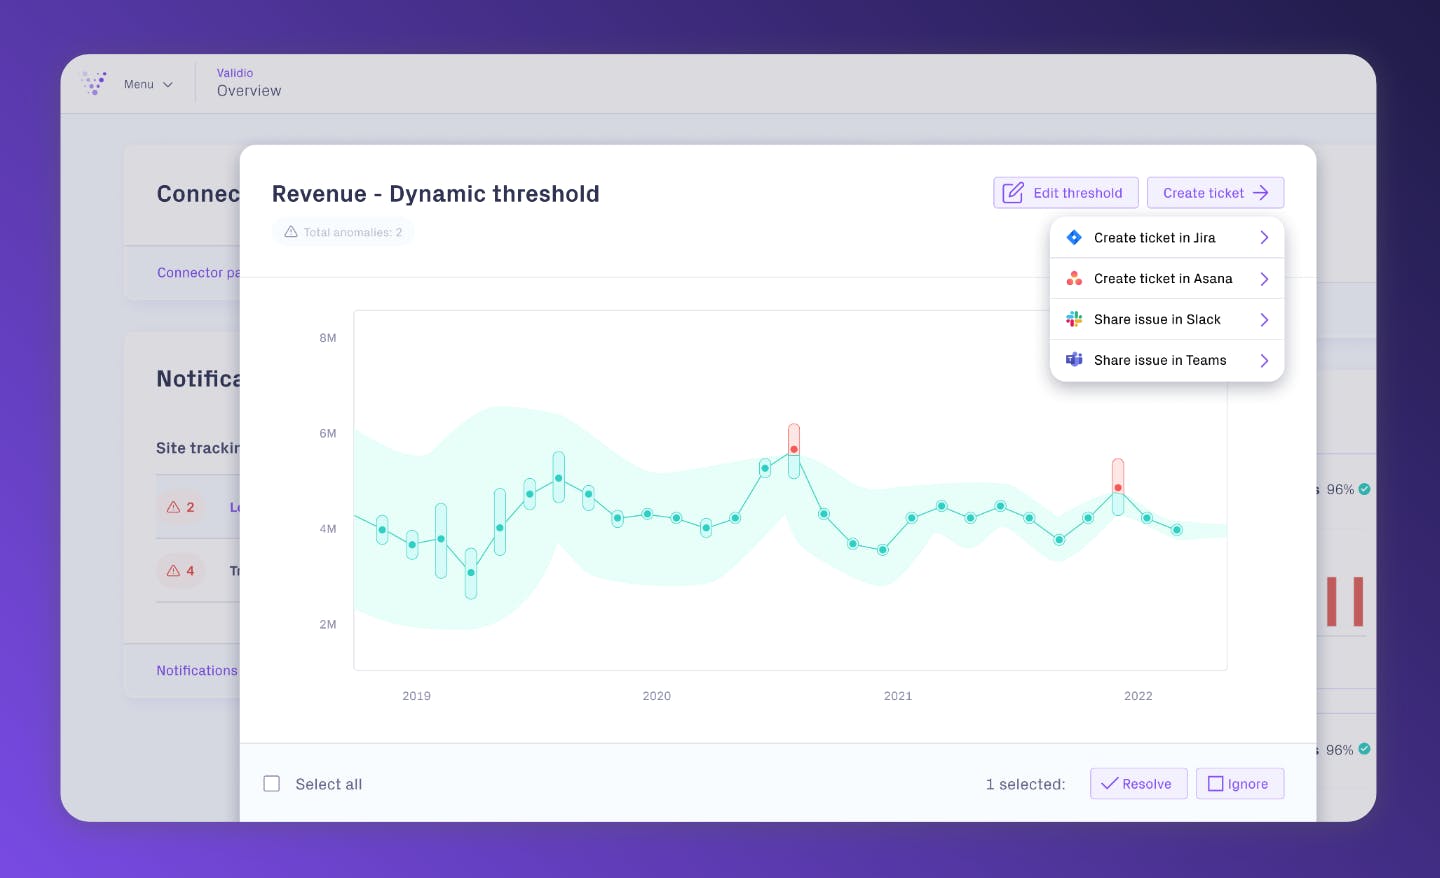
The platform also offers a Criticality Triage functionality that lets teams collaborate and prioritize issues based on their impact. Users can edit thresholds, as well as resolve or ignore issues, depending on their level of criticality. This enables OmniShop to allocate resources effectively and address the most important issues first.
What’s next?
OmniShop has now successfully implemented a Deep Data Observability platform to catch anomalies in their Kinesis Stream. This helps them reduce the time to detect and resolve data issues and mitigates their potential impact on the business.
Next, they can apply and scale the process for all of their relevant data sources, data warehouses and lakes included, across the organization.
Seeing is believing
Get a personalized demo of how to reach Deep Data Observability with Validio.