Platform

Data Quality & Observability

Detect anomalies anywhere in your data, in real time

Lineage

Get to the root cause and resolve issues quickly

Data asset insights

Discover data assets and understand how they are used

Discover the product for yourself

Take a tour
CustomersPricing

Learn more

Customer stories

Hear why customers choose Validio

Blog

Data news and feature updates

Reports & guides

The latest whitepapers, reports and guides

Events & webinars

Upcoming events and webinars, and past recordings

Heroes of Data

Join Heroes of Data - by the data community, for the data community

Data maturity quiz

Take the test to find out what your data maturity score is

Get help & Get started

Dema uses Validio to ensure the data quality for their prescriptive analytics

Watch the video
Guides & Tricks

When dashboards aren't enough: amplifying Looker with machine learning based alerts

February 10, 2025
Elof GerdeElof Gerde
You’ve built a beautiful maze, but now you’re lost in it.

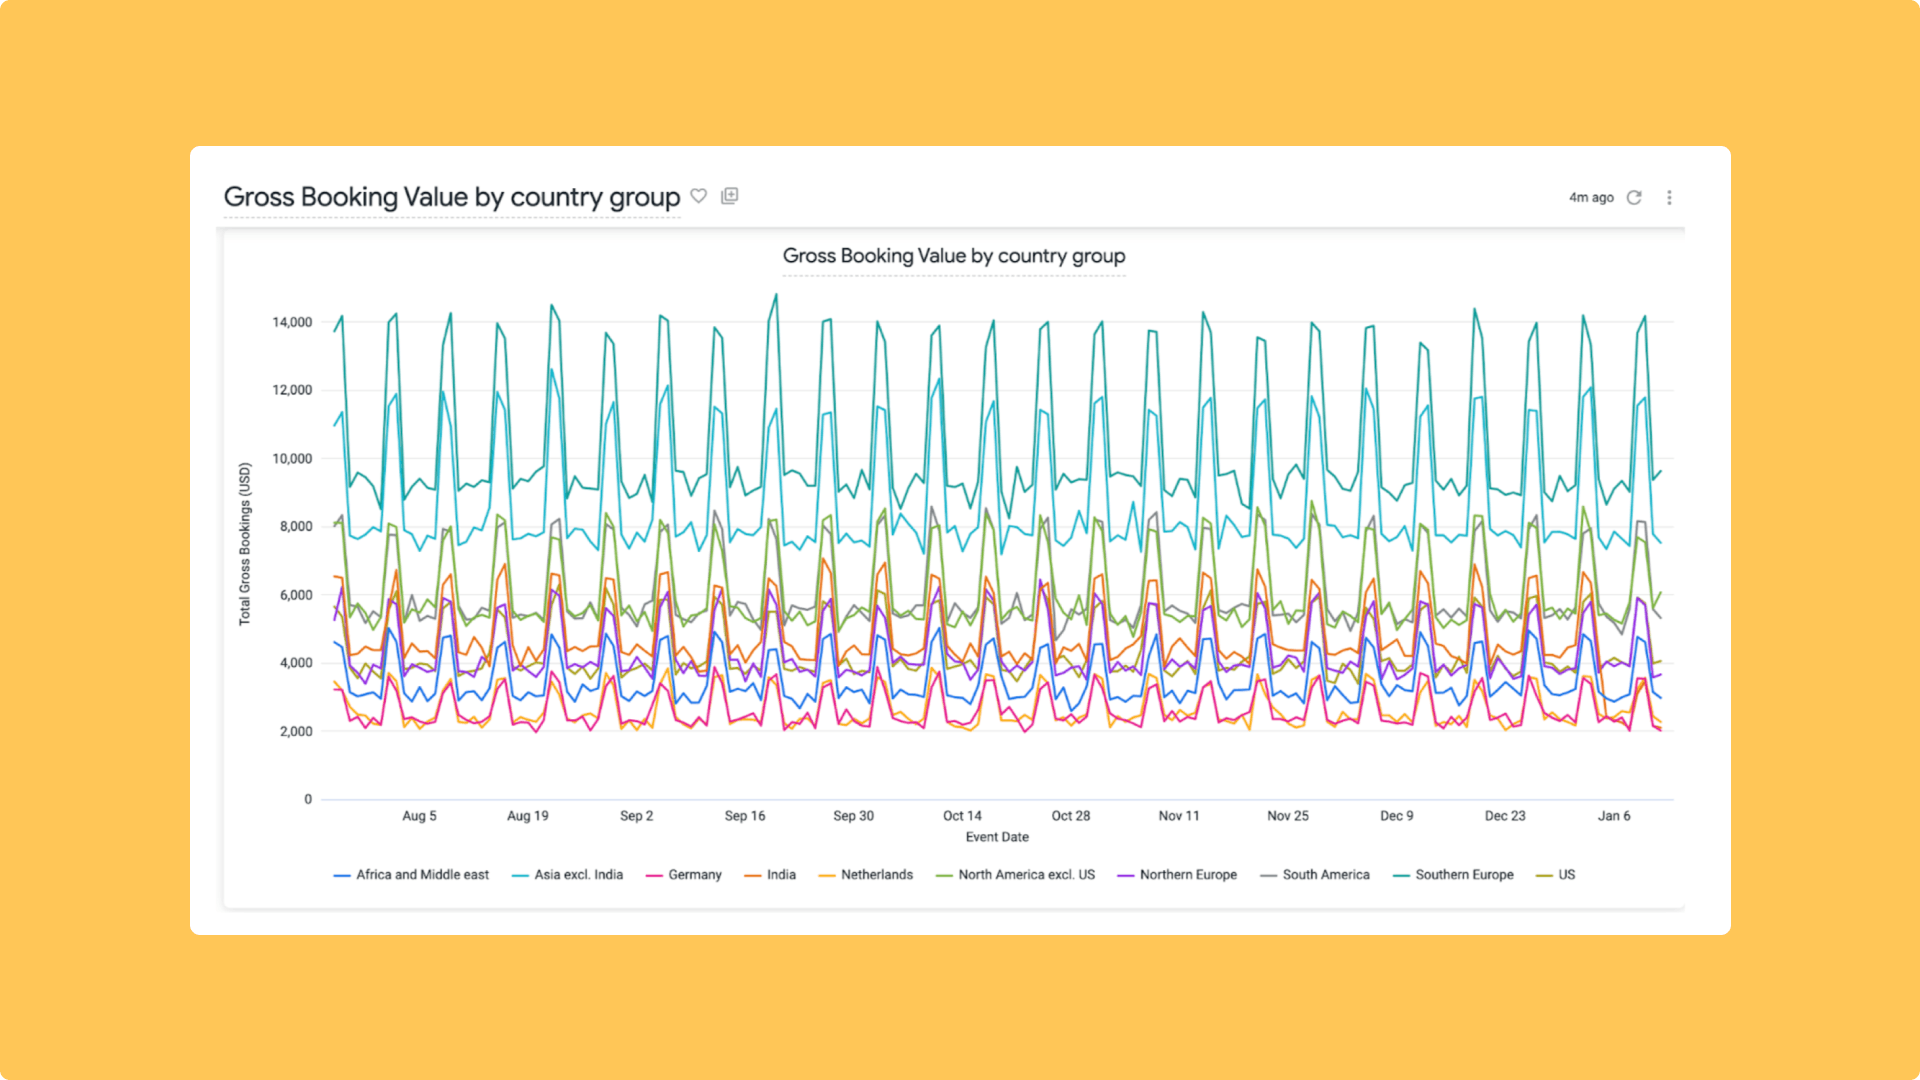
Looker has become a cornerstone for data analysts and business intelligence teams, offering powerful dashboards and a unified source of truth. However, as organizations scale and the number of tracked metrics explodes, a new challenge arises:

how do you ensure that critical insights don’t get lost in the noise?

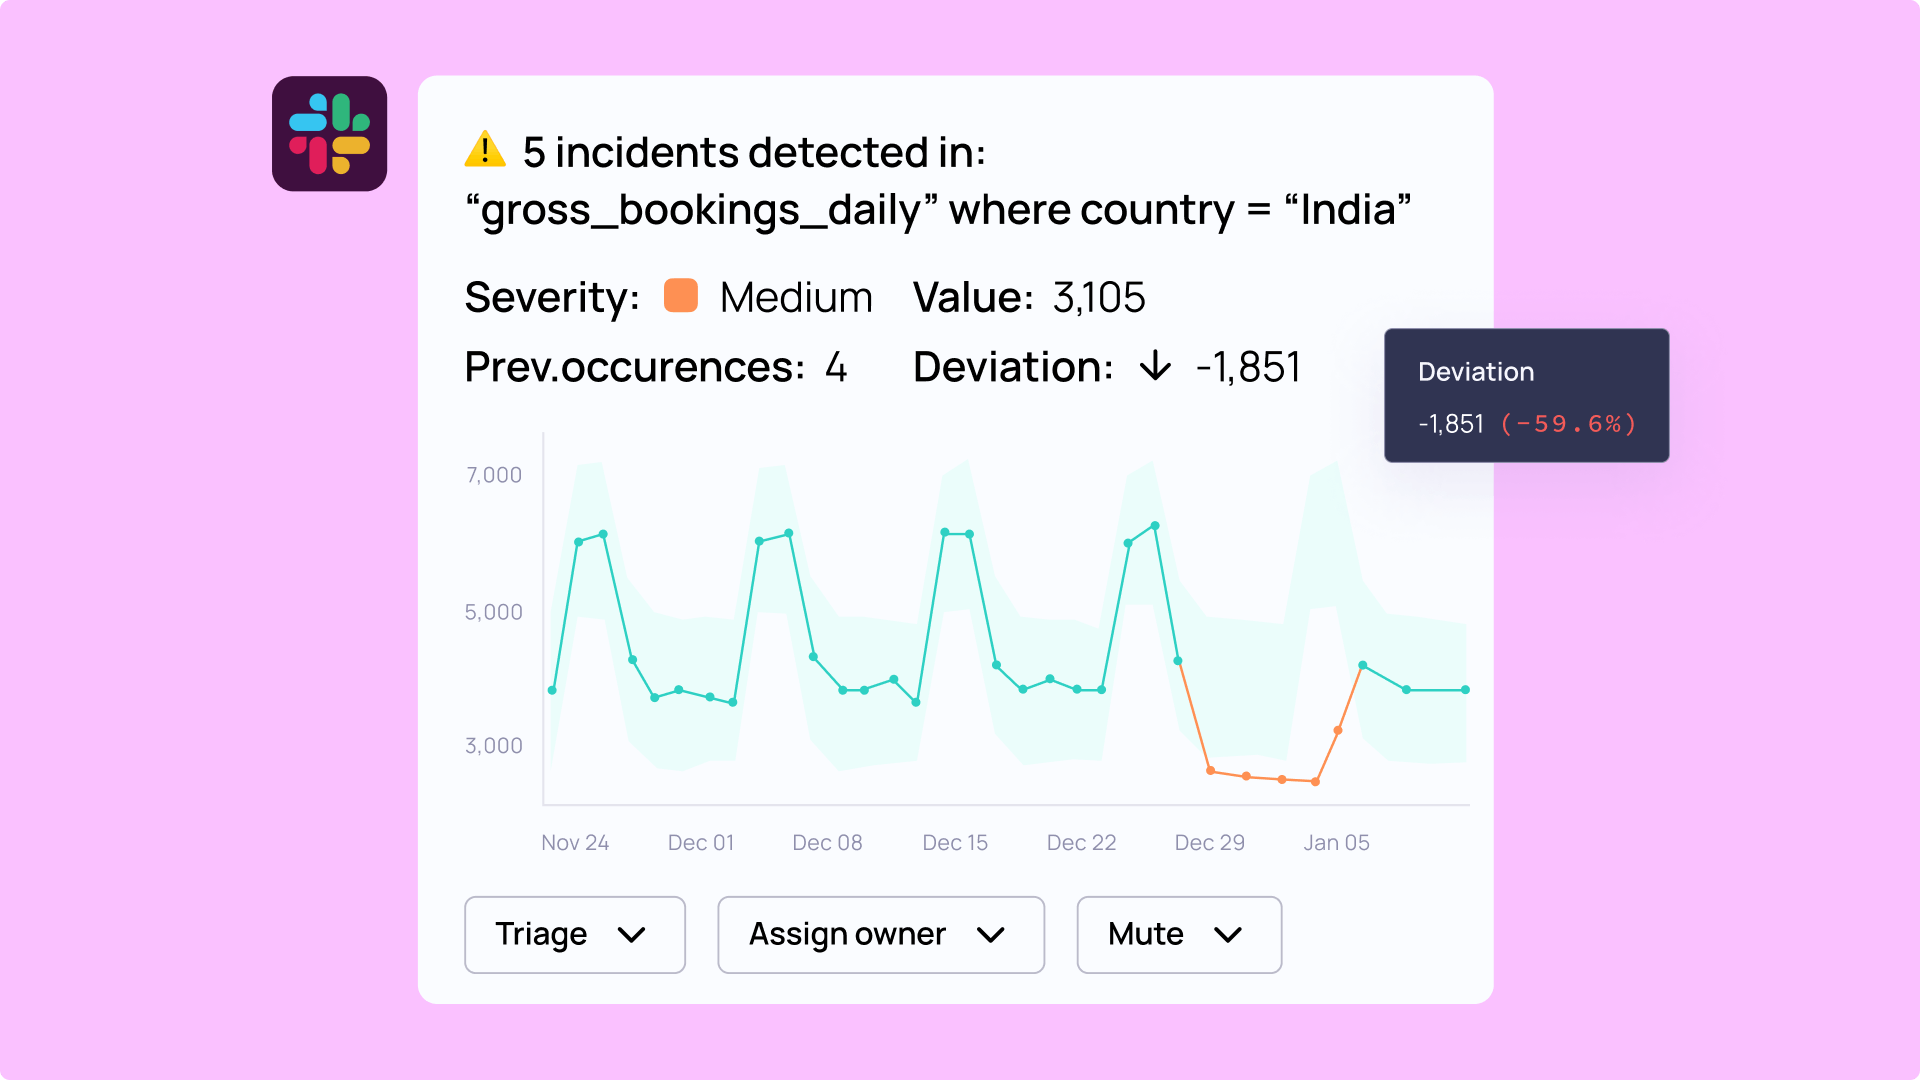
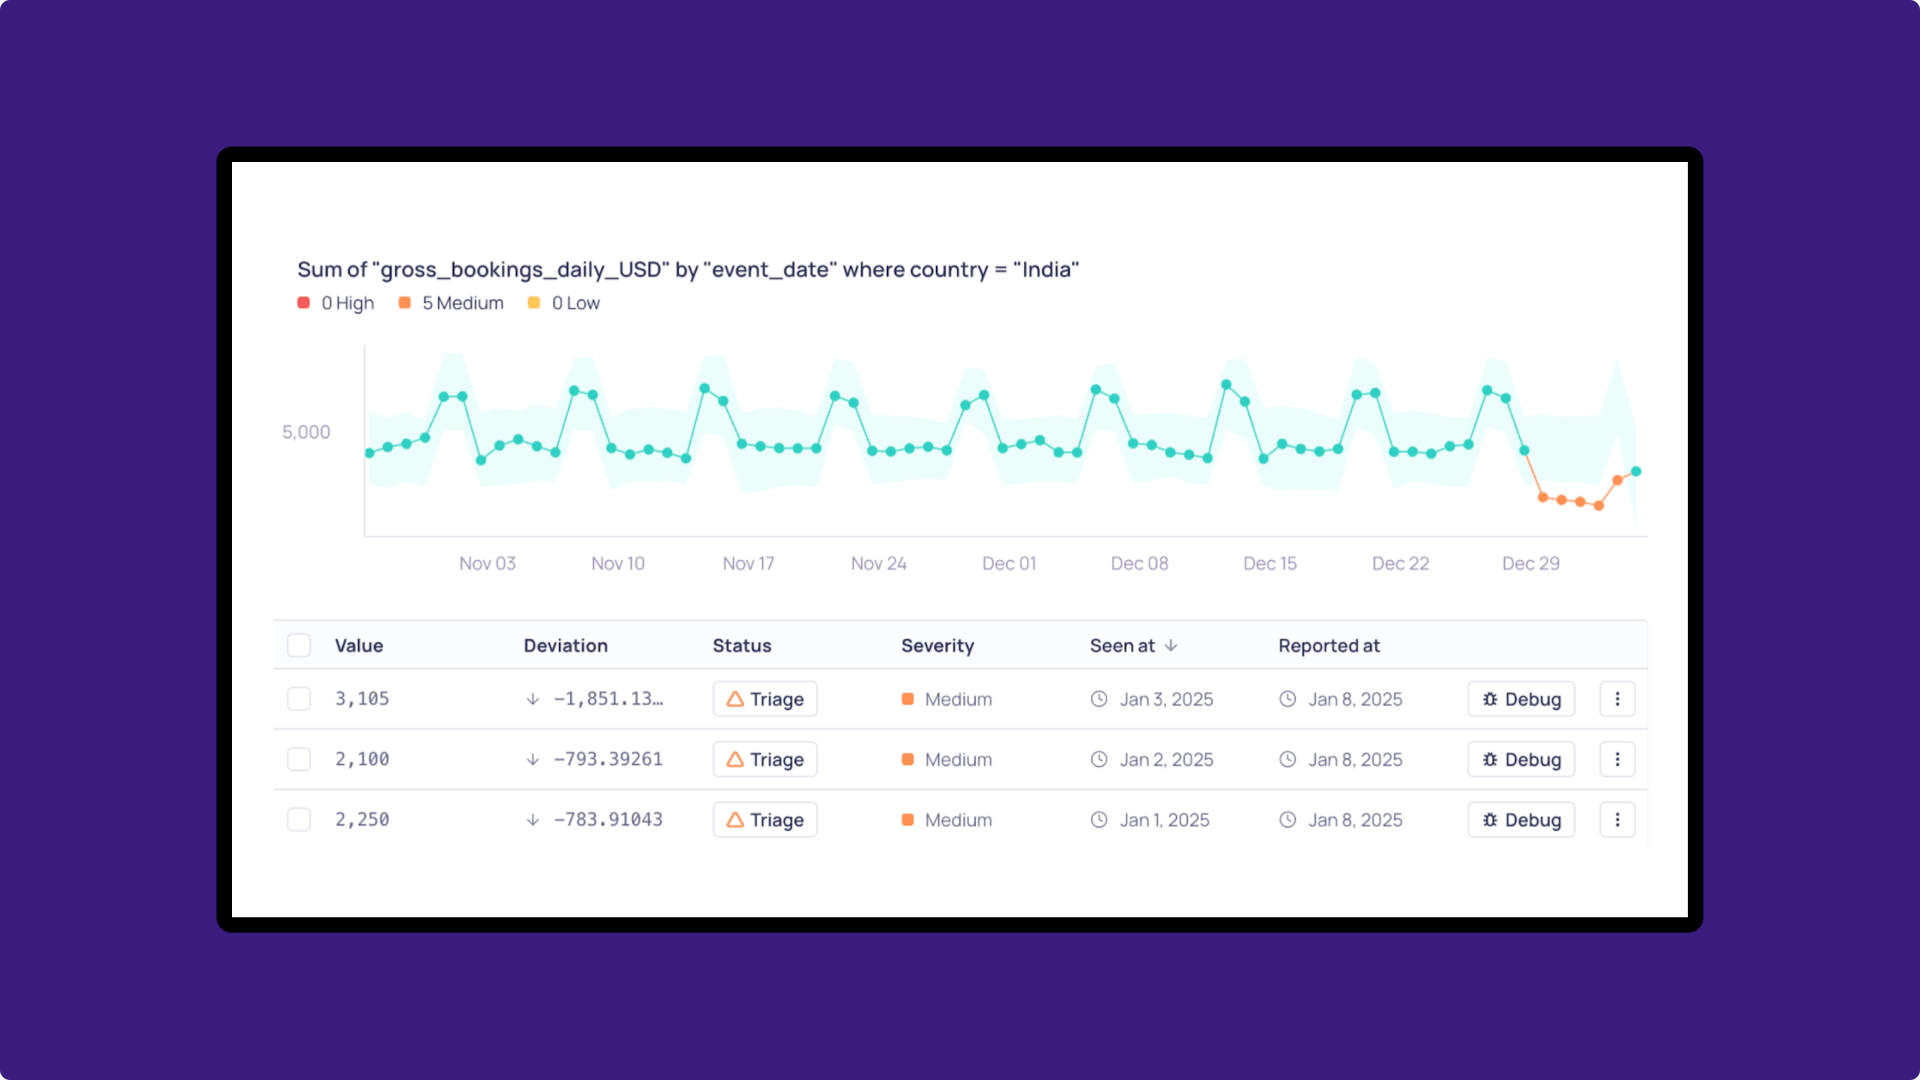
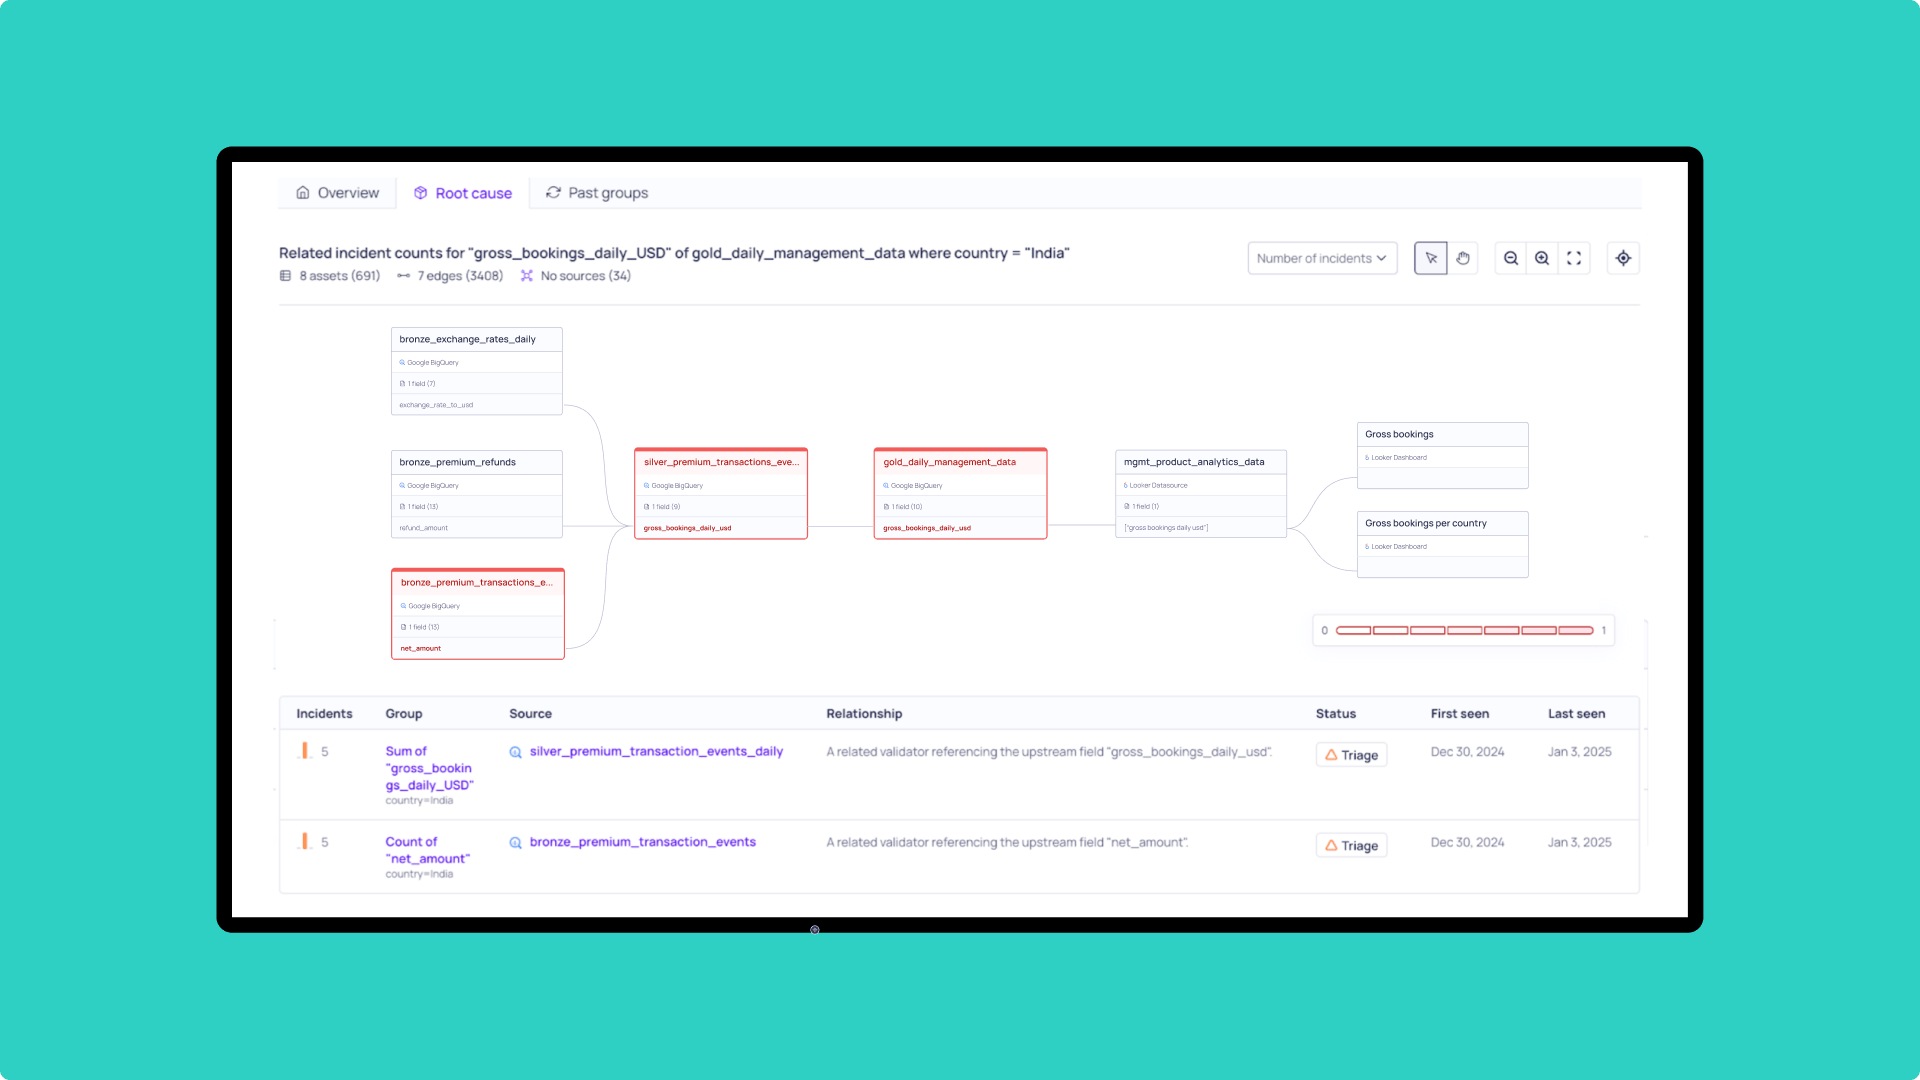
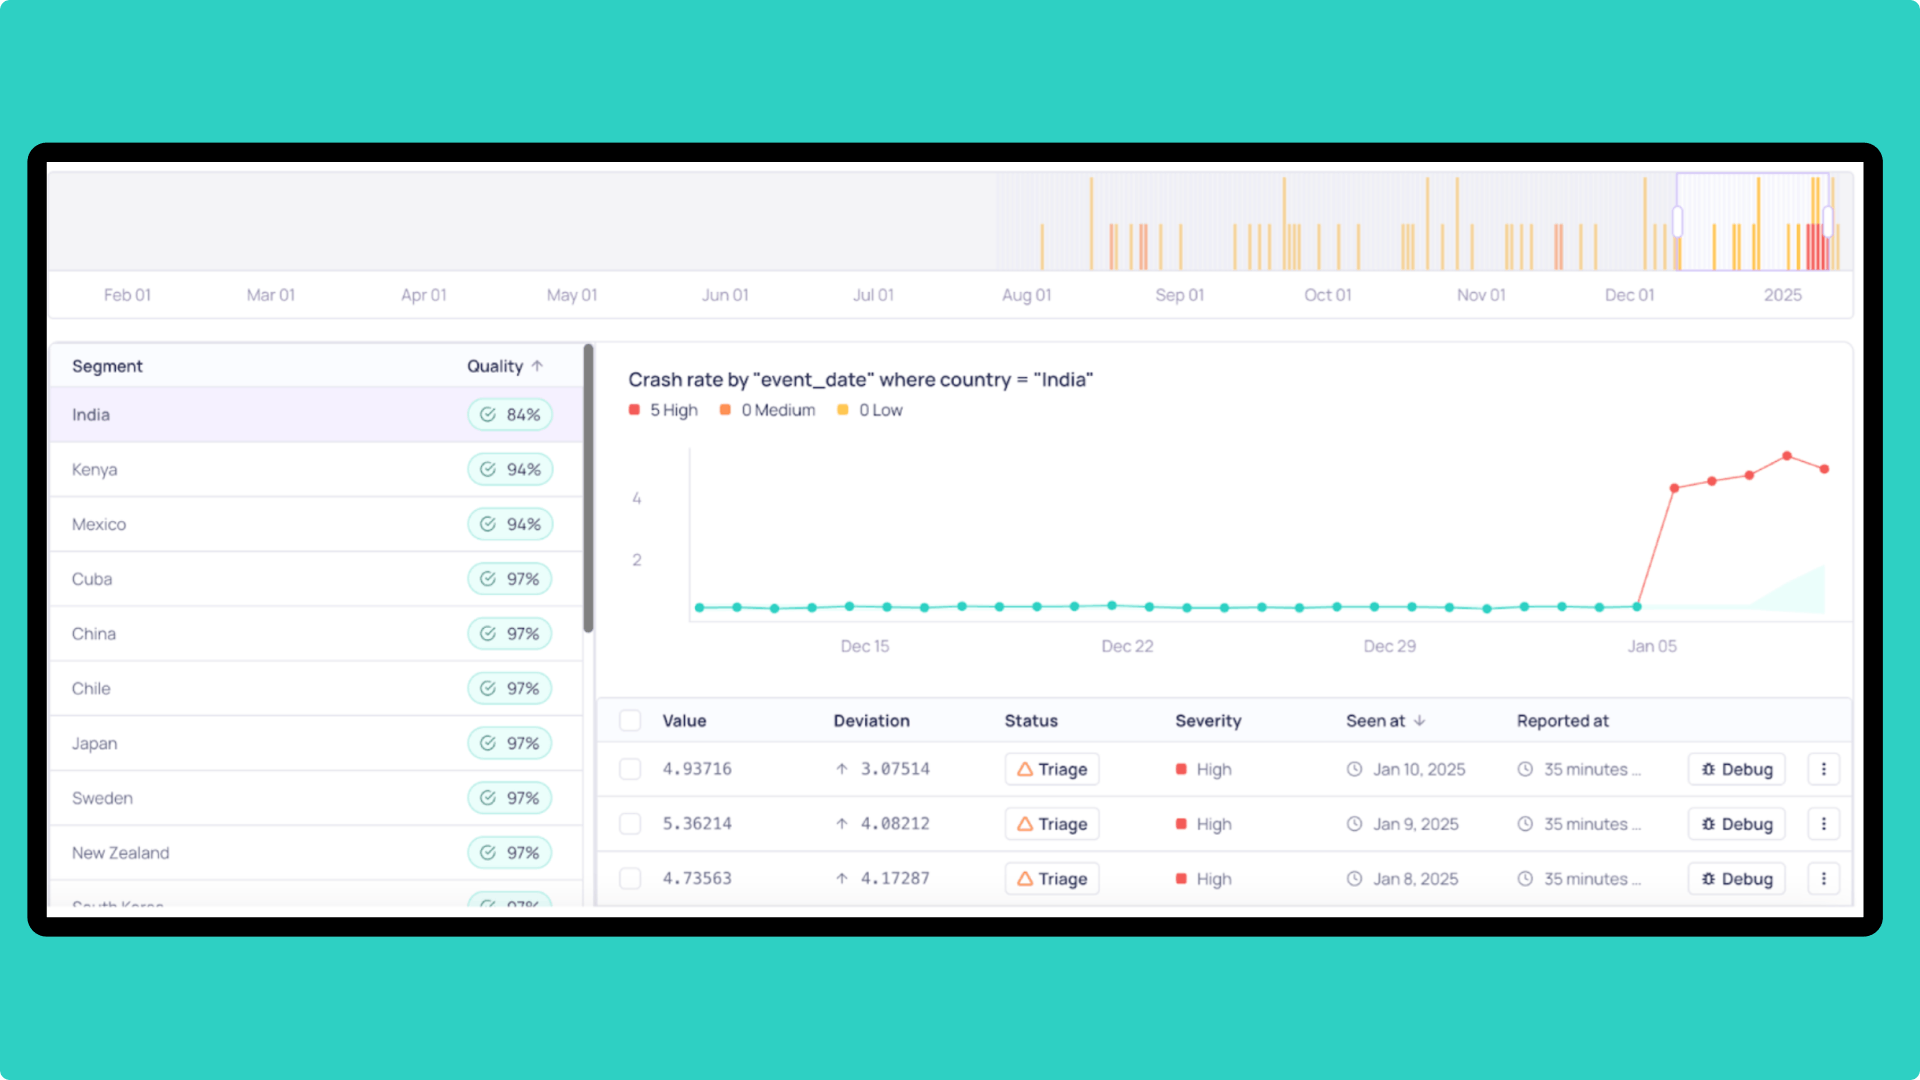
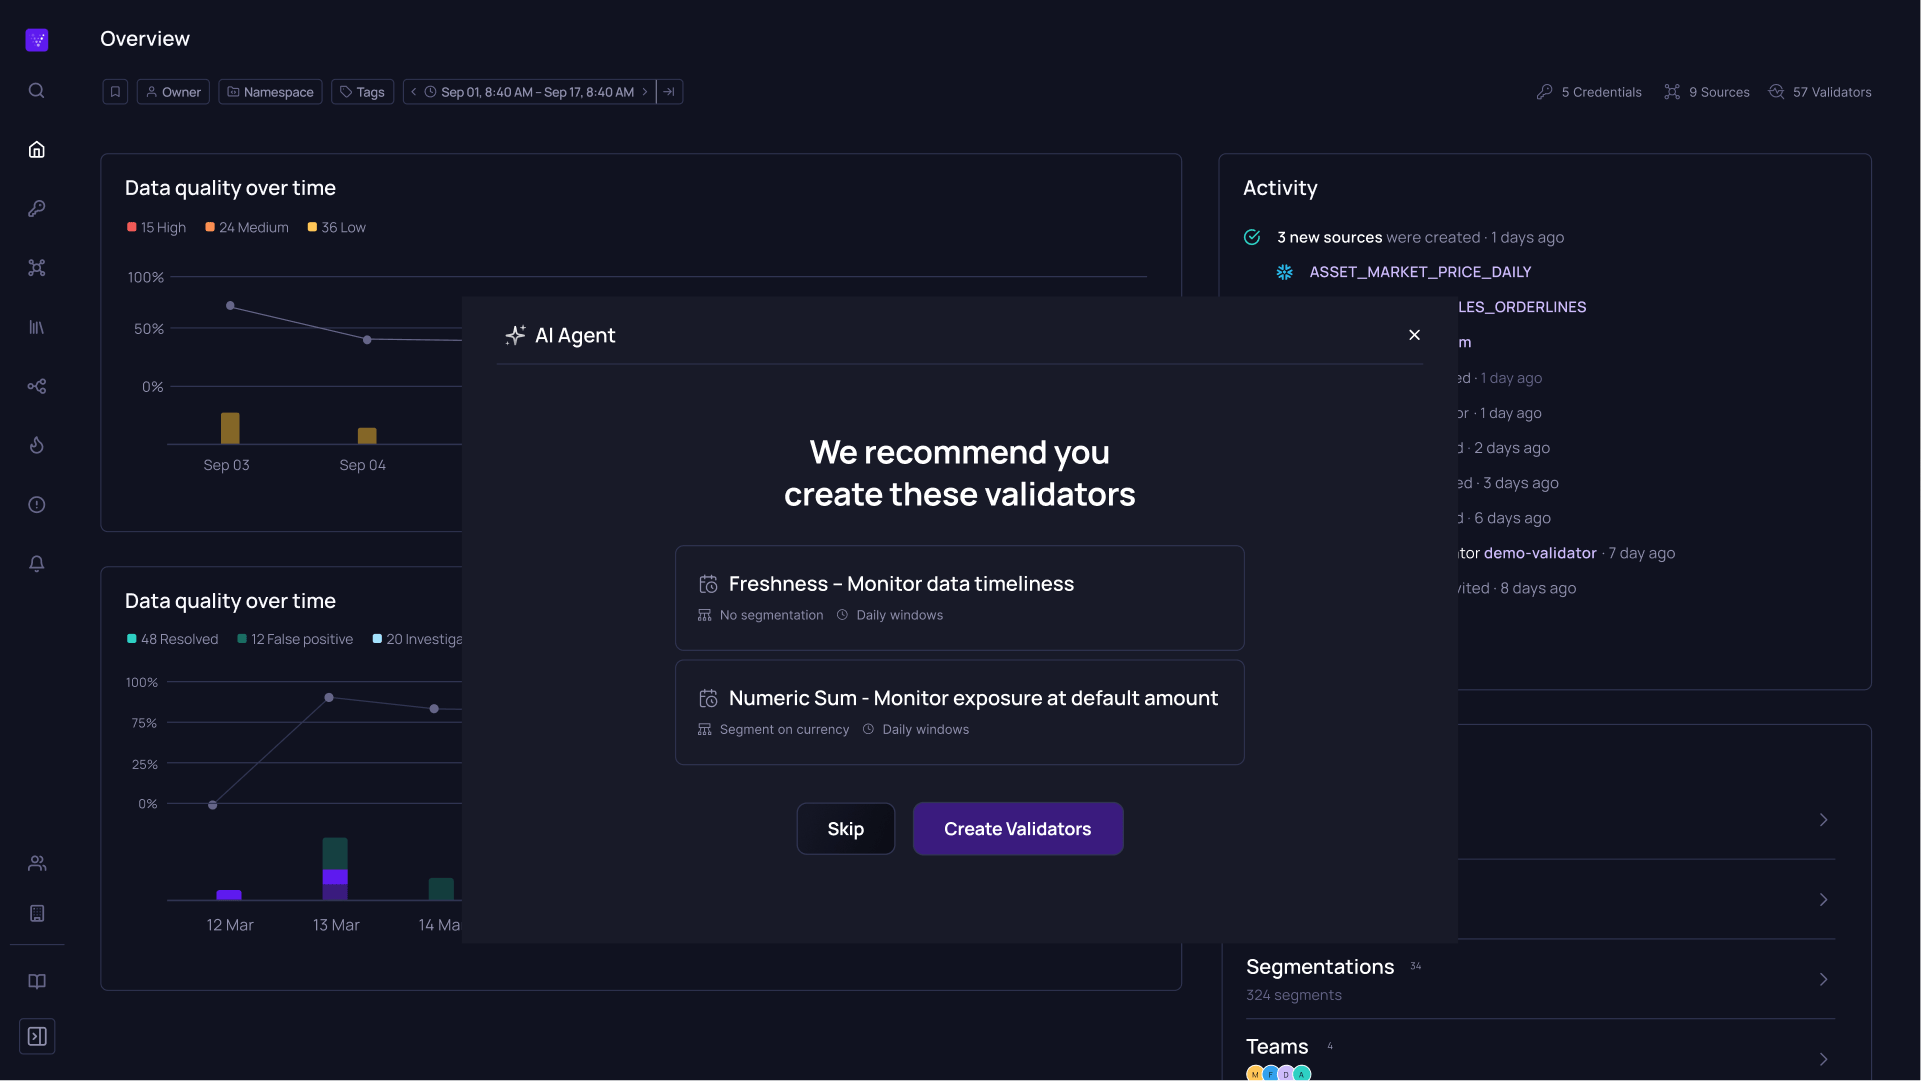
Most companies simply don’t have the time to monitor the dashboards as much as they need. Slowly drifting metrics or critical business anomalies are easily overlooked. Looker’s built-in alerting is useful but often too simplistic for teams managing complex, high-volume data environments. That’s why companies like Volt and Alliance Bernstein are turning to Validio. By adding a machine learning powered alerting system and notification workflow on top, analysts can catch both real-life changes and data quality issues before they impact the business. In this article, we’ll explore Looker’s alerting limitations and how Validio fills the gaps—so you can move beyond just dashboards and into proactive, intelligent data monitoring.

🚩 TABLE OF CONTENTS

  1. The intro to Looker
  2. Common limitations of Looker's alerting
  3. Using data observability to plug the gap
  4. Setting up Validio for the same metrics as you have in Looker
  5. Conclusion

Let’s take it from the beginning

The business intelligence platform Looker saw rocket-sized growth during the 2010’s and 2020’s, driven largely by three standout product design philosophies:

  • Creating one source of truth for metrics, where data teams could define metrics in a centralized data modeling layer (LookML). This eliminated the chaos of having multiple SQL definitions for the same metric.
  • Making adoption easy for developers and data teams – LookML felt familiar to those comfortable with coding, while still abstracting away raw SQL complexity. They offered robust APIs, allowing teams to automate workflows, embed analytics into custom apps, or integrate Looker’s functionality into broader data pipelines. 
  • Making adoption easy for non-technical users – With the central LookML layer in place, data consumers could easily create dashboards without writing a single line of code.

Fast forward a couple of years, and Looker is one of the market leading BI tools.

However, organizations use Looker so much that another problem is starting to arise. How do you stay on top of all metrics and make sure that the organization is acting on them? The below graph is showing Gross Bookings per country. There is a significant drop (more than 5 figures USD per week) in one of the countries. Can you spot it? What if you have 20 other dashboards you’re also expected to keep track of – could you?

Later in this article, you’ll see how users would consume the same information via Validio.

A graph showing Gross Bookings daily in Looker, with a large deviation in one segment.

While Looker’s native alerting capabilities can notify you about basic threshold breaches, they leave significant gaps for teams that need more advanced and flexible data monitoring. This is where Validio steps in. Validio provides more sophisticated alerts, deep insights, and real-time feedback loops that ensure your data and metrics remain accurate and trustworthy.

In this article, we’ll explore Looker’s alerting limitations, how Validio addresses each shortcoming, and how to set up Validio validation if you’re already leveraging Looker for BI and analytics.

Common limitations of Looker’s alerting

As more and more dashboards are created, the issue of monitoring them becomes increasingly difficult.

We spoke to Peter Xiong Ni, VP of Data Infrastructure & Analytics at Volt, who experienced this first hand: "With the modern data tech stack and visibility of BI tools, it is not that difficult to spot issues with those metrics once. Oftentimes, our analyst could easily spot the trend when looking at the data. But no one is able to do that 24/7 and if I know anything about life, it is that it knows to hit us at the worst possible times. Issues often happen on a Friday late night or even Sunday morning, leaving merchants with declined payments and lost transactions, forcing our merchant success team constantly in defense mode and struggling with fire fighting.

So, being able to identify anomalies in payment metrics repeatedly, consistently and scalably is where Valido comes in and shines with its monitoring and alerting capabilities."

"No one is able to spot issues 24/7 and if I know anything about life, it is that it knows to hit us at the worst possible times. Issues often happen on a Friday late night or even Sunday morning. So, being able to identify anomalies in payment metrics repeatedly, consistently and scalably is where Valido comes in and shines with its monitoring and alerting capabilities."

Despite Looker’s robust visualization and analytics capabilities, its native alerting has several constraints, leading most users to avoid adopting it. These are some of the limitations:

1. Limited alert conditions

  • Static single-measure triggers: Looker alerts are generally based on a single measure with a static threshold, which can quickly fall short when dealing with seasonality (e.g., weekends behaving differently than weekdays or patterns varying between the start and end of a month) or trends in the data (e.g., consistent growth over time). In such cases, static thresholds often fail to provide precise or meaningful insights.
  • Identical thresholds across all segments: Whether you’re looking at different regions, channels, or customer types, Looker applies the same threshold for every dimension.

2. Frequency and scheduling constraints

  • Hourly scheduling minimum: Looker’s alerts typically evaluate data on an hourly or daily schedule. Real-time or near-real-time monitoring isn’t supported natively.

3. Lack of context in the alert

  • No historical context: Alerts only check the current data result against a threshold; there’s no built-in historical view of the metric that triggered the alert (e.g., “The metric that triggered – how has it developed over time?”).
  • No graphical visualization of thresholds: When in Looker, it’s not immediately clear what the thresholds are if you’re viewing the dashboard, which makes it less clear why an alert was triggered

4. No root cause analysis or Data Lineage

  • Absence of lineage: There’s no straightforward way to see the origin or transformation path of data points causing the alert to fire. This makes diagnosing issues time-consuming.

5. Limited Slack notifications and routing logic

  • No dynamic routing: Although you can send a Slack notification, there’s no native way to direct different alerts to different teams (e.g., sending high-severity alerts to a specific Slack channel or personalizing notifications based on data tags).

6. Limited incident management

  • Absence of incident management features: The process around what to do when an incident occurs is crucial. Being able to assign owner of issues, triage them, add comments to the incidents become important functionality to resolving issues and keeping everyone informed

Using data observability to plug the gap

Validio is built for real-time data quality monitoring, anomaly detection, and alerting. It’s designed to complement analytics tools like Looker by ensuring data is accurate and issues are flagged well before they impact dashboards or downstream decisions.

Before diving into the details, let’s look at how the gross bookings graph would have looked like in Validio:

Step 1. First point of contact – A slack notification outlining that we had a drop in gross bookings for the country=India.

Step 2. Validio dashboard – Dynamic thresholds showing gross bookings for India, where 5 medium severity alerts have been triggered.

Step 3. Field level lineage from Looker Dashboards to the source tables in BigQuery, tracing back the data quality issue to the ‘net_amount’-field in the ‘bronze_premium_transactions’-table.

1. Advanced alert conditions

  • ML-powered thresholds: Instead of relying on fixed numeric thresholds, Validio uses machine learning to determine what “normal” looks like—factoring in seasonality, trends, and variability. These advanced models can be set up and trained in minutes.
  • Unique thresholds per segment: Validio’s thresholds can be applied across dimensions (for example: region, channel, product category, etc.), so that each segment has a unique threshold adapted to its seasonality and data pattern.
  • Multi-dimensional conditions: Validio allows you to combine data from multiple dimensions (e.g., “For each channel in each country, monitor the volume of daily transactions”) and set alerts accordingly.

2. Real-time frequency and scheduling

  • Truly real-time monitoring: No more waiting for hourly or daily schedules. Validio continuously checks data streams, enabling you to catch issues the instant they arise.

3. Historical context in alerts

  • Graphs and trends in Slack: When an alert fires, Validio can include a quick snapshot graph or trending line in your Slack channel (or other communication tool of choice), giving you immediate insight into how the metric has been behaving over time.
  • Bi-directional Slack integration: Collaborate in Slack by assigning an owner, adding comments, and automatically syncing these updates back into Validio, so all context is preserved.

4. End-to-end root cause analysis

  • Full data lineage: Validio provides a clear view of where your data originates and how it’s transformed. When something goes wrong, you can trace the data pipeline back to the source to quickly diagnose and fix the issues

5. Flexible Slack notification routing

  • Route by tags, severity, or monitor type: Validio lets you define routing rules so alerts get sent to the right person or channel based on the data’s tags, the type of monitor, or the severity of the incident.

Setting up Validio for the same metrics as you have in Looker

If you’re already using Looker for dashboards and analytics, monitoring these dashboards in Validio is  a straightforward process. Validio monitors the underlying data sources that feed the Looker dashboards. You can select a Looker dashboard in the Validio platform and see what the underlying data sources are through the Lineage view.

Once you’ve found the underlying sources, you can use out of the box validators to monitor standard things like freshness, completeness, summary statistics (e.g. mean, sum, std) on a table level or segment by segment. 

However, you can also recreate the exact metrics shown in the Looker dashboards through the custom SQL-validator.

Monitor Looker-based metrics in Validio

As an example, let’s look at the following table covering crash rate by country:

Step 1: Export the raw SQL from Looker: Go to your Looker dashboard, find the query or “Explore” that generates the metric you want to monitor, and copy the raw SQL. You might need to unpivot all dimensions first.

Step 2: Recreate metric in the Validio Custom SQL validator: Create a custom SQL validator in Validio. Paste the SQL into the Validio platform, and make sure to modify it to fit with Validio syntax. Validio largely mirrors the syntax of the table you’re trying to monitor (e.g. BigQuery syntax for BigQuery tables, Snowflake syntax for Snowflake tables etc.,), with a few Validio specific variables.

Step 3: Explore the results: The thresholds get trained on your historical data, so you should see a graph in seconds. Make any adjustment on the threshold sensitivity or window size (the monitoring frequency).

Step 4: (Optional) Start routing alerts via Slack, Teams or Webhook: Use Validio’s integration to route alerts to the appropriate channels. Utilize routing rules and tagging of validators to direct the right types of alerts to the right stakeholders, both for notifying data owners and the users that rely on the data. 

Conclusion

Looker remains a powerful BI platform for exploration and visualization, but very few adopt its built-in alerting because it lacks simplicity in setting up, and sophistication in the underlying monitoring. By complementing Looker with Validio’s ML-driven real-time monitoring, you gain the ability to spot anomalies faster, tailor alerts more precisely, streamline root cause analysis, and ultimately ensure that your dashboards and metrics remain reliable at all times. We look forward to doubling down on our Looker integration to make the experience even more seamless.

Level up your Looker alerting?

Set up real-time monitoring in Validio

Start for free