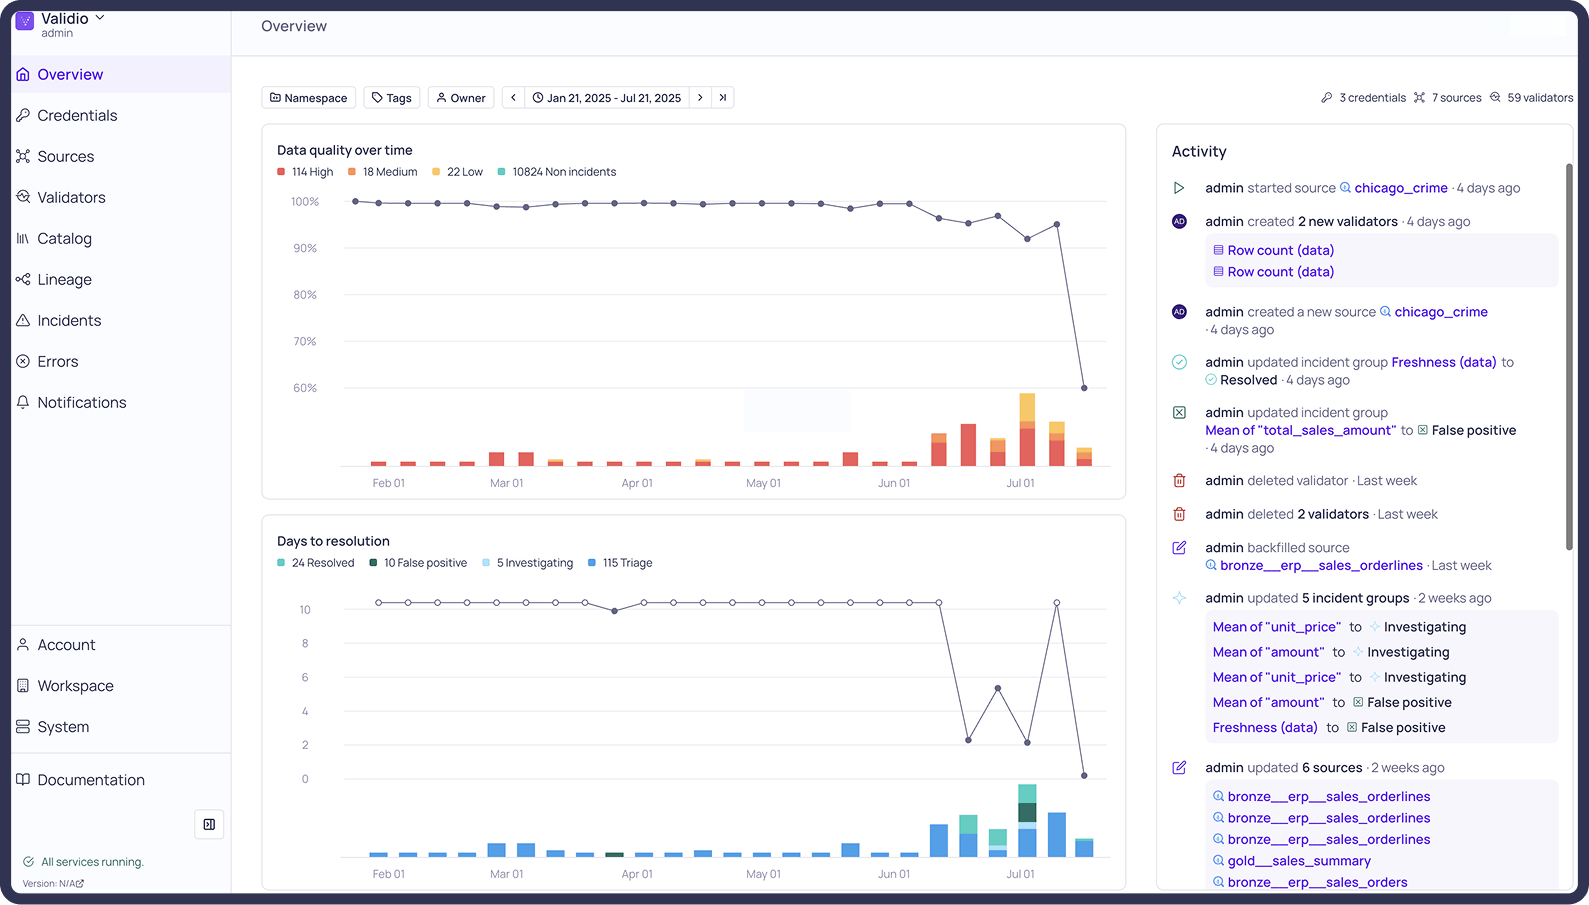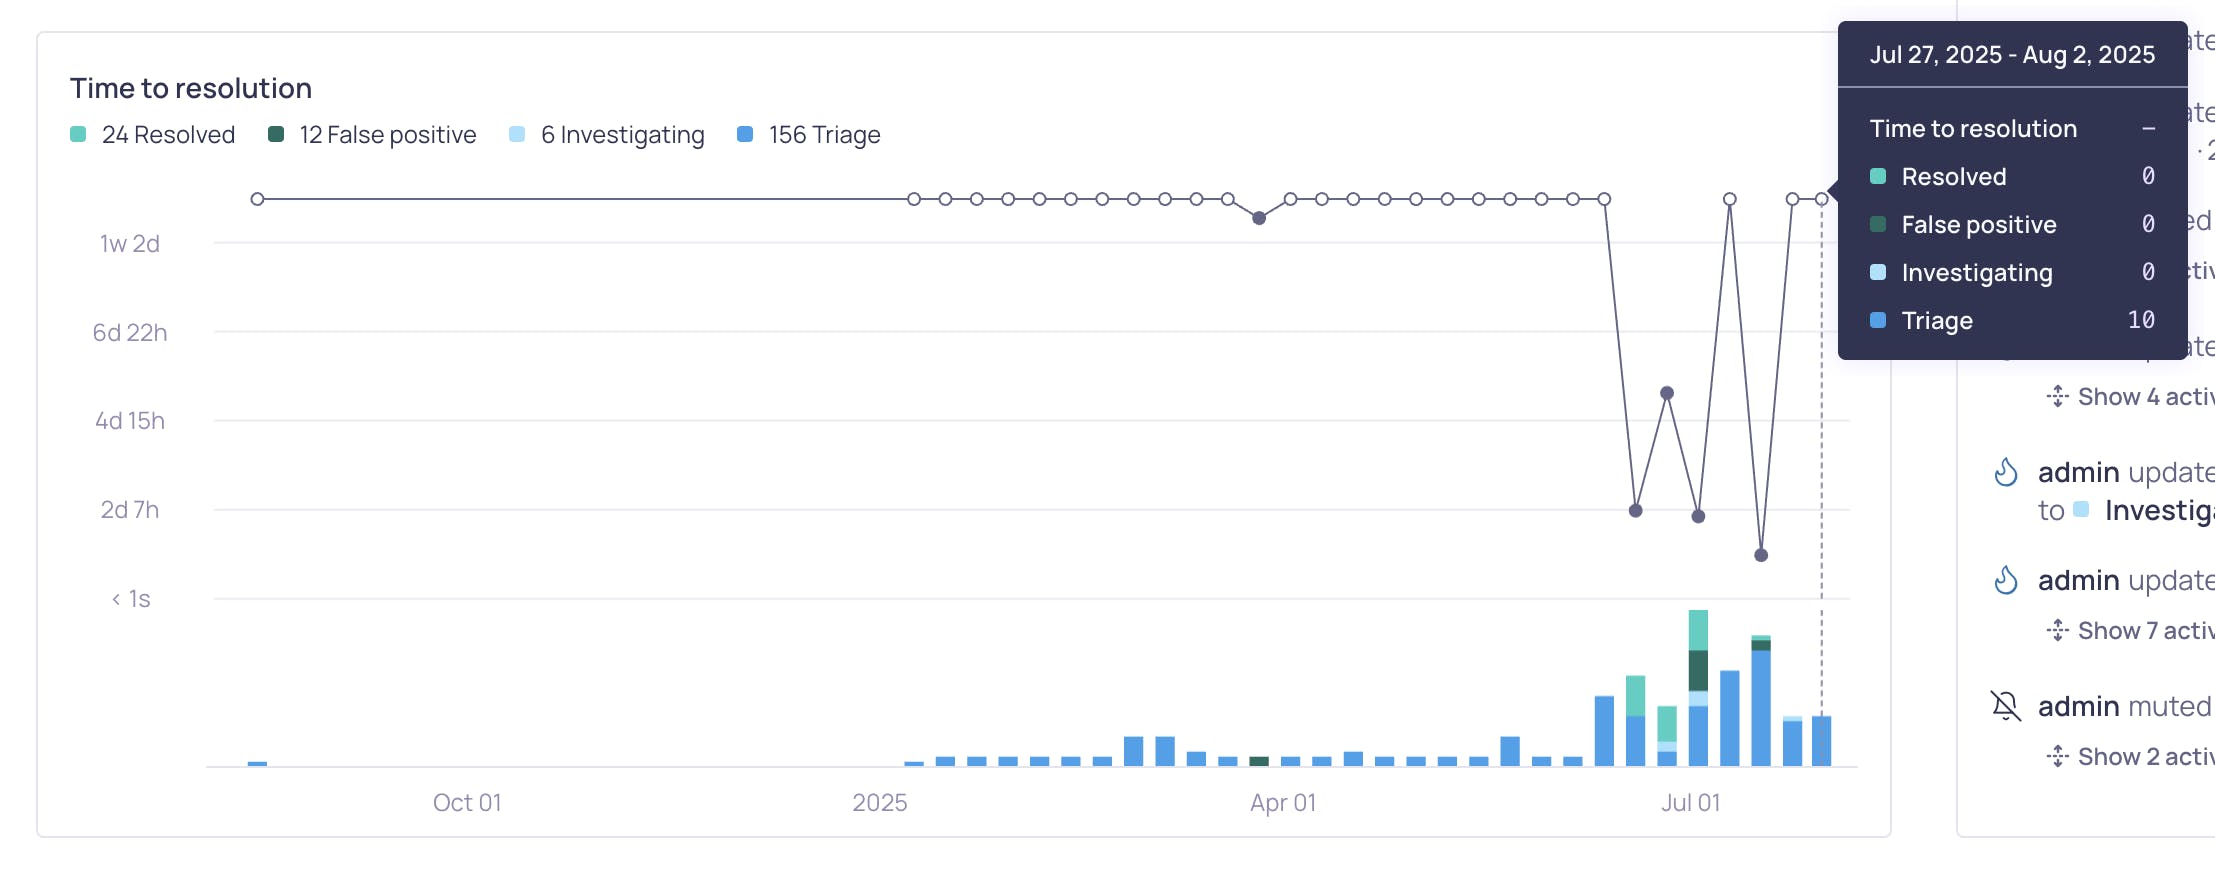


In fast-moving data environments, it’s not enough to know that incidents are happening—you need to understand where, when, and how they affect your business. In Validio 5.2, we’ve completely redesigned the overview dashboard and on-page graphs to easily track data quality KPIs over time. The overview dashboard gives a direct snapshot of data quality over time, how quick incidents are resolved, and what the latest activity is.
One place for all your data quality insights
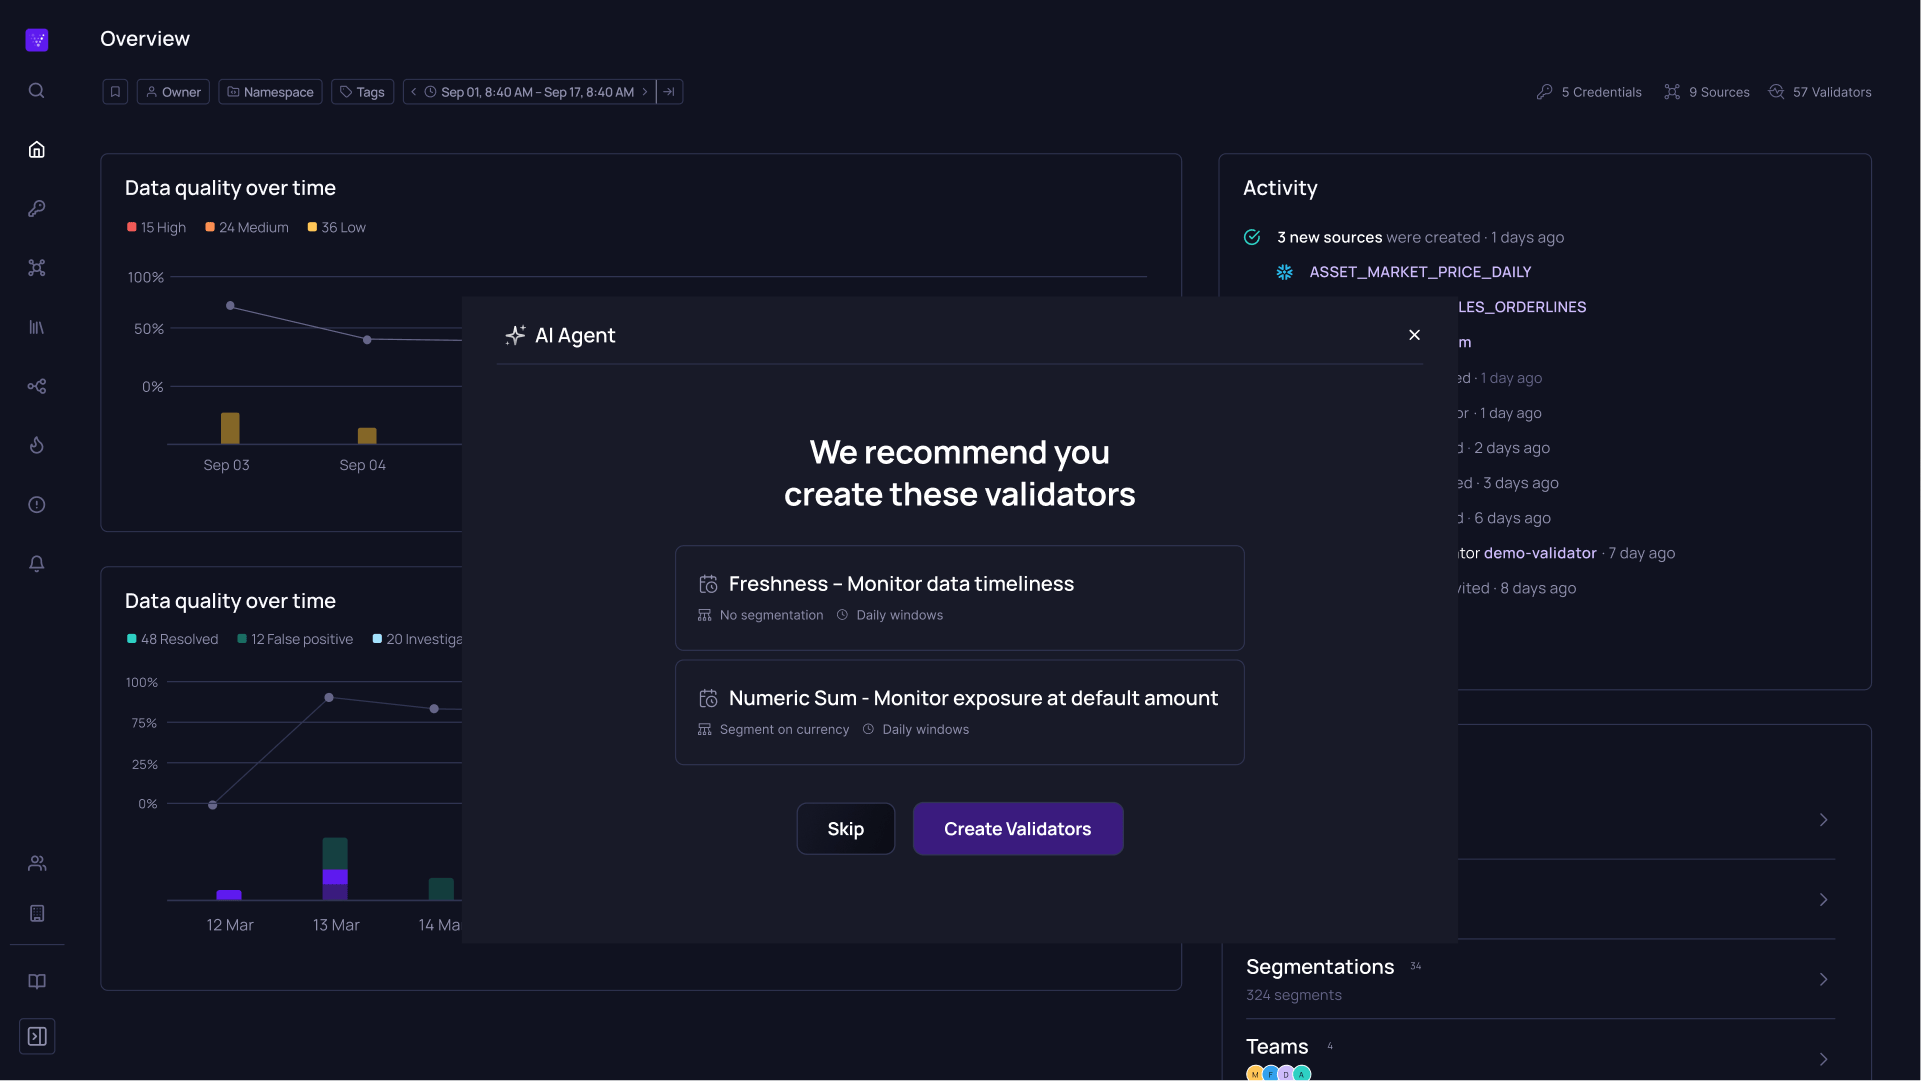
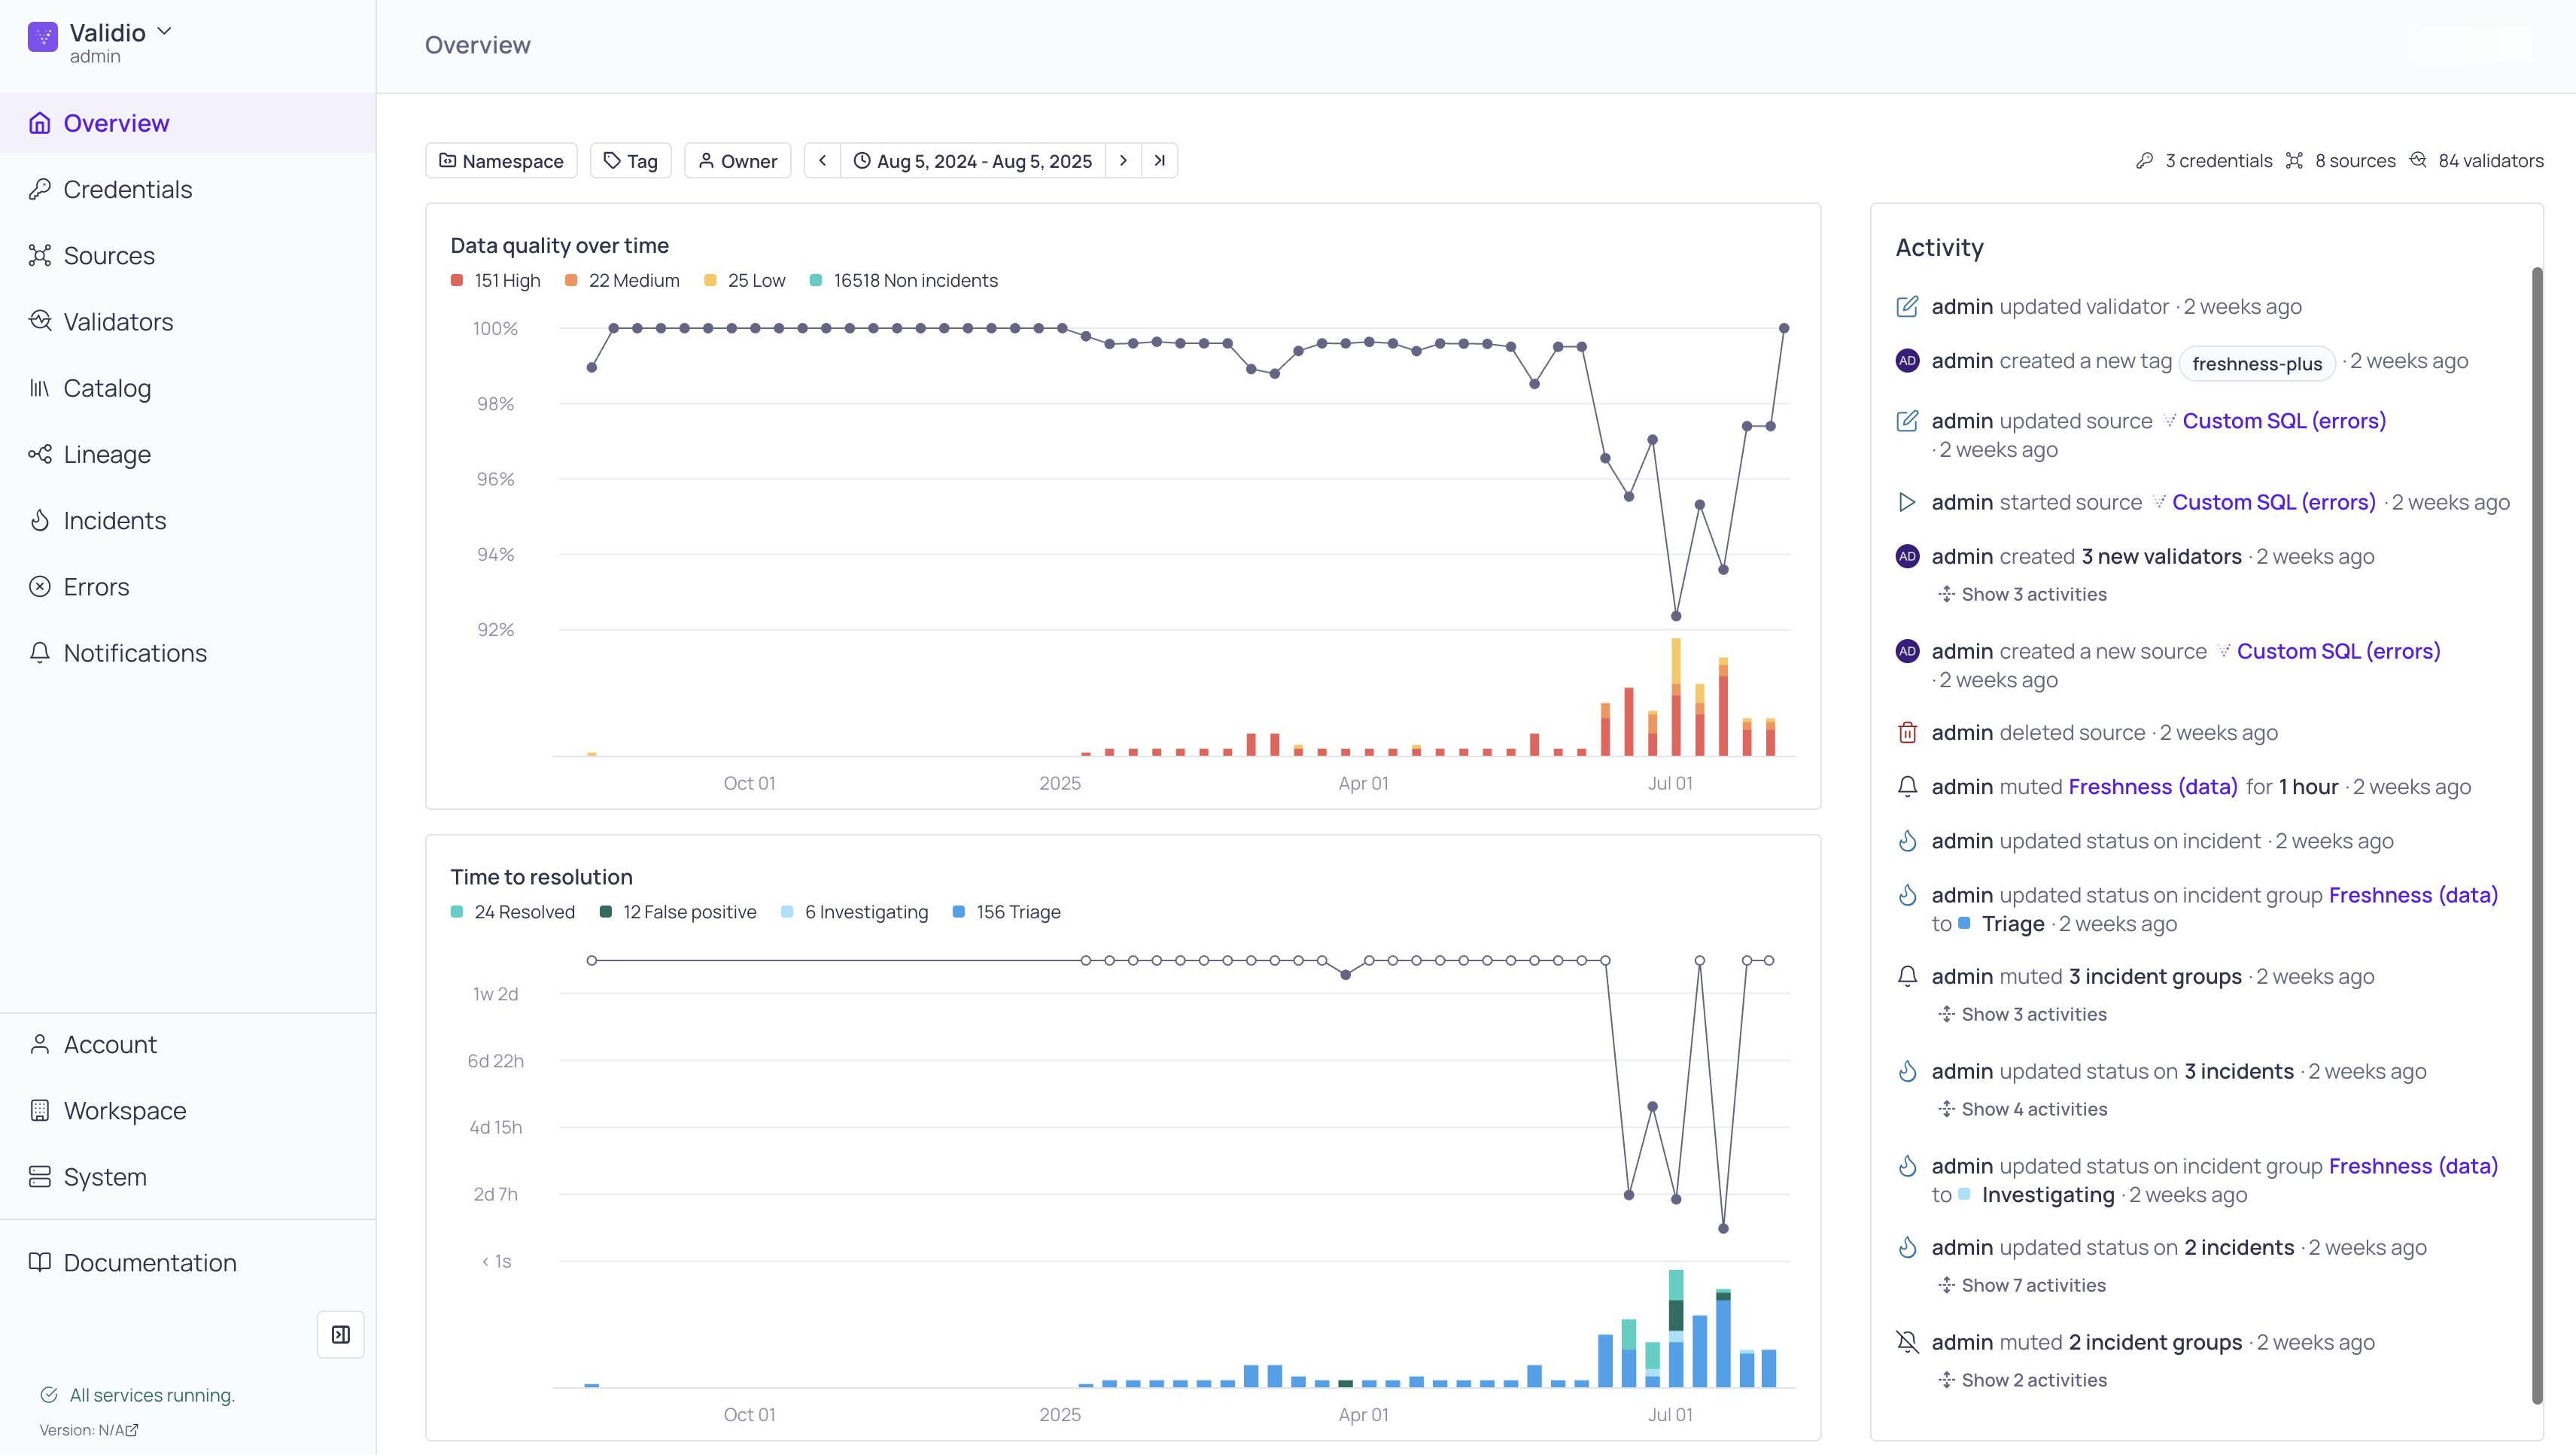
The Overview page has gotten a complete facelift to better highlight key operational metrics like Data quality and Incident resolution. At the heart of the new dashboard is the Data Quality graph, showing your data quality score over time with an incident severity breakdown. Instead of just knowing that something went wrong, you now see how data quality is trending, where the most highest severity is (High, Medium, Low), and how your efforts to improve are paying off. This makes it easier to demonstrate progress to stakeholders and justify investments in data quality initiatives.