Platform

Data Quality & Observability

Detect anomalies anywhere in your data, in real time

Lineage

Get to the root cause and resolve issues quickly

Data asset insights

Discover data assets and understand how they are used

Discover the product for yourself

Take a tour
CustomersPricing

Learn more

Customer stories

Hear why customers choose Validio

Blog

Data news and feature updates

Reports & guides

The latest whitepapers, reports and guides

Events & webinars

Upcoming events and webinars, and past recordings

Heroes of Data

Join Heroes of Data - by the data community, for the data community

Data maturity quiz

Take the test to find out what your data maturity score is

Get help & Get started

Dema uses Validio to ensure the data quality for their prescriptive analytics

Watch the video
Data Trends & Insights

The exponential impact of bad data

August 14, 2024
Emil BringEmil Bring

Poor data quality is like having a conversation with mixed-up facts—good luck convincing anyone. And just as flawed information disrupts a conversation, bad data can throw a wrench in the works for businesses relying on it to make choices, run products, or serve customers. Yet, the impact varies. When business-critical data is bad — inaccurate, incomplete, inconsistent, or outdated — it can have serious consequences.

In this blog post, we’ll explore the impact of bad data, the importance of data quality solutions, and the difference between data quality and observability. We will also look at some real-world examples of bad data quality and its effects.

🚩 TABLE OF CONTENTS

→ What is bad data?

→ The impact of bad data gets worse over time

→ 6 common causes of bad data

→ 5 real-world examples of poor data quality

→ Data observability as a starting point to fight bad data

→ Data quality vs data observability

→ Ensuring full data trust extends beyond observability

What is bad data?

Bad data is data that doesn't meet the expectations or requirements of the intended users or purposes. Bad data can be caused by various factors, such as human errors, system failures, malicious attacks, or lack of standards and governance. Some common examples of bad data are:

  • Missing or incomplete data, such as customer records without email addresses or phone numbers.
  • Inaccurate data, such as product prices that don't reflect the current market value or inventory levels that don't match the actual stock.
  • Inconsistent data, such as customer records that have different names or addresses in different databases or systems.
  • Outdated data, such as sales reports that don't reflect the latest transactions or customer feedback that isn't relevant.

The impact of bad data gets worse over time

Data issues, if left unresolved, can cascade through an organization. They start with the technical teams and eventually reach customers and the wider public. The impact amplifies over time—from small operational inefficiencies to broad organizational disruption, unhappy customers, and potential legal risks.  Detecting and fixing problems early is key in stopping this escalation. It shows the need for proactive data quality management to protect business health.

null

The ripple effects of bad data touch every facet of your business.

Letting data issues linger creates a domino effect, impacting more and more functions:

  • Data Engineers: Spend more time troubleshooting and less on innovation. Bad data leads to increased workload, as it requires extensive validation and correction processes that could have been avoided.
  • Data Consumers (e.g. Data Scientists/Analysts/Operations): Compromised business decisions. Inaccurate or incomplete data affects everything from marketing to prediction models and sales forecasting.
  • Employees: Reduced productivity and morale. Employees struggle with inefficient processes and systems, leading to frustration and a decrease in team performance and job satisfaction.
  • Customers: Eroded trust and satisfaction. Customers face inconvenience or dissatisfaction when personal data is mishandled or when products and services don't meet expectations due to underlying data issues.
  • Public: Negative perception and reputation damage. Public incidents of data inaccuracies can lead to a loss of confidence in an organization, impacting its brand and long-term success.

These consequences underline the critical role of strong data management in maintaining data that’s both trustworthy and consistent throughout the company.

6 common causes of bad data

Data-led organizations need continuous measures to catch bad data early, protecting their business and customers. To do that without spending hours on manual detective work, data teams need automated monitoring. It ensures their data is always fit for purpose so they can focus on innovation and other initiatives.

Now, let's explore six common causes of bad data and how to monitor them.

1. Numeric anomalies: Monitor metrics like mean, min, max, and standard deviation
  • Data entry errors: Manual data input often leads to inaccuracies.
  • Incorrect data integration: Mishandling data from multiple sources can distort aggregate measures.
  • Sensor malfunctions: Automated data collection systems sometimes fail, impacting recorded values.
  • Outlier transactions: Uncommon, significant transactions (e.g., bulk purchases) can temporarily skew data. 
2. Distribution errors: Monitor numeric distribution to ensure stable trends over time
  • Seasonal variations: Overlooking periodic fluctuations can mislead trend analysis.
  • Market changes: Significant shifts in the market environment can alter data trends unexpectedly.
  • Data processing errors: Inaccurate calculations or transformations can impact the overall data distribution.
3. Mismatched timestamps: Check the smallest and largest time intervals
  • System timezone misconfigurations: This can lead to inconsistencies in recorded times across datasets.
  • Network latency: Delays in data transmission can affect timestamp accuracy.
  • Processing delays: Bottlenecks in data pipelines can introduce unexpected time lags.
4. Volume issues: Monitor duplicates, NULL values, unique values, and row counts
  • Duplication errors: Repetition in data ingestion processes can inflate row counts.
  • Data loss: Incomplete data transfer or storage failures reduce record counts. Aggressive data cleaning mistakenly destroys valuable information.
5. Categorical distribution shifts: Detect if categories are unexpectedly added or removed
  • Evolving product lines or services: New offerings might introduce unexpected categories.
  • Data misclassification: Incorrect assignment of records to categories.
  • Changes in data categorization rules: Updates to categorization logic can lead to shifts in distribution.
6. Late data: Ensure your data is always fresh and up to date
  • Delayed data pipelines: Slow processing can cause data to lag behind the real-world events it represents.
  • Infrequent updates: Not refreshing data sources regularly can leave outdated information in use.
  • External data source delays: Relying on third-party data ties your dataset to their timelines.

Data teams can use these causes to predict issues and take preemptive measures. By monitoring these dimensions continuously, you guarantee not just the safety of your data but also its usefulness. This ensures decisions are made on the newest, fullest, and most correct information available.

5 real-world examples of poor data quality

Case study 1: Unity's $110 million ad targeting error

Unity Technologies, known for its real-time 3D development platform, experienced a severe misstep with its ad targeting services. A malfunction in their data algorithms led to inaccurate ad targeting, resulting in substantial revenue loss and disgruntled advertisers. This miscalculation undermined advertiser trust and led to a loss of approximately $110 million. CEO John Riccitello outlined the implications of the incident, noting:

  • A direct effect on revenue streams.
  • Expenditures related to the restoration efforts, including rebuilding and retraining of models.
  • Postponed feature launches that could drive revenue, as resolving data quality issues took precedence.

Case study 2: The fatal Boeing 737 Max catastrophe

Boeing, a leader in aerospace engineering, faced a critical challenge with its 737 Max aircraft, leading to a profound reevaluation of software integration in aviation safety. In this instance, a failure to adequately consider and communicate changes in the aircraft's Maneuvering Characteristics Augmentation System (MCAS) software played a central role in two tragic accidents. This oversight highlighted the importance of data integrity and transparent communication in complex system design.

  • Refined software protocols: Post-accident, Boeing enhanced the 737 Max software and introduced stricter testing to ensure robust flight safety.
  • Upgraded training programs: The incidents highlighted the necessity for detailed pilot training, incorporating simulator experiences for mastery of new software.
  • Strengthened review processes: In collaboration with regulators, Boeing enhanced the review and certification procedures for new aircraft, prioritizing transparency and rigorous safety standards.

Case study 3: Uber’s fare calculation blunder

In 2017, Uber made headlines admitting that it had underpaid its drivers in New York City by tens of millions of dollars due to a data error in its fare calculation system. The error, which lasted for more than two years, resulted in Uber taking a higher commission than it should have from the drivers’ earnings. Uber had to refund the drivers and pay a $20 million settlement to the Federal Trade Commission for misleading drivers about their potential income.

The error's ripple effect was profound:

  • Financial restitution: Uber had to refund drivers to fix the earnings discrepancy, highlighting the costly consequences of inaccuracies in data.
  • Regulatory repercussions: The Federal Trade Commission slapped Uber with a $20 million settlement for misleading drivers about their earning potential, underscoring the regulatory risks associated with data mishandling.

Case study 4: UK's COVID-19 data error

Amid the COVID-19 crisis, the UK's data infrastructure faced a crucial test when almost 16,000 cases were left unreported. At the heart of this was a simple yet impactful flaw: a spreadsheet that could not handle the volume of data required. As a result, essential contact tracing activities suffered delays, creating gaps in the effort to control the spread of the virus. Public Health England's systems were suddenly under the microscope, exposing a need for data management solutions that could keep pace with surging demands.

Immediate outcomes:

  • Disruption in disease tracking and response practices, resulting in public health repercussions.
  • Intensive examination of data management capacity and system resilience.

Case study 5: The 2020 US Census self-response discounts

The 2020 US Census was marked by innovative efforts to improve participation rates, including the strategic use of discounts to encourage self-response. Despite good intentions, the execution stumbled, with reliance on out-of-date data models causing ineffective resource distribution. By directing incentives to areas with already high compliance, the Census Bureau inadvertently overlooked communities in greater need of support.

Consequential outcomes:

  • Misdirected resources that impacted census integrity and overall success.
  • Escalated needs for community engagement and corrective data measures, straining operational workflows.

These cases make one thing abundantly clear: meticulous attention to data quality is vital in any sector. It's the fine line between success and failure, impacting everything from safety to financial health.
Data observability as a starting point to fight bad data

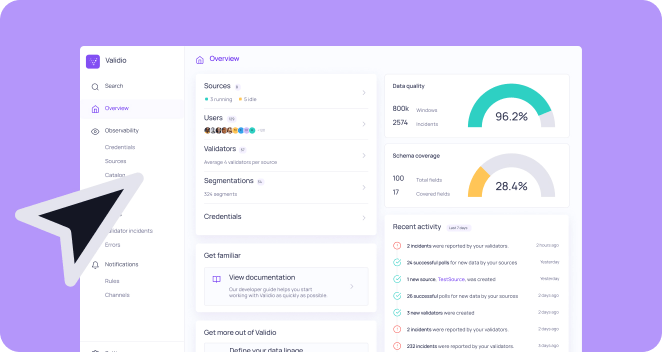
Data observability is the ability to monitor, measure, and understand the health and quality of data throughout its lifecycle. Data observability enables businesses to:

  • Detect and diagnose data issues, such as errors, anomalies, or inconsistencies, in real-time or near real-time.
  • Trace and troubleshoot data issues, such as identifying the root causes, sources, and impacts of data issues, and resolving them quickly and effectively.
  • Prevent and predict data issues by using automated data quality checks, rules, and alerts. Also, leveraging data analytics and machine learning lets you anticipate and avoid potential data issues.

How data observability improves data quality

Data observability is essential for improving data quality, as it provides businesses with:

  • Visibility: Data observability provides a full view of the data landscape. It covers the data sources, pipelines, transformation steps, and destinations. This helps businesses to understand the origin, context, and meaning of their data. It also helps them ensure that their data is consistent, accurate, and complete.
  • Accountability: Data observability provides a clear and transparent record of the data history. It includes the data's origin, lineage, and metadata. It also covers the data's changes, updates, and modifications. This helps businesses to track and audit the data lifecycle, and to ensure that their data is trustworthy, reliable, and compliant.
  • Actionability: Data observability provides actionable insights. It recommends data improvements with quality scores and indicators. It covers data issues, their root causes, and solutions. This helps businesses to prioritize and address any data-related issues, and to optimize data quality.

Data quality vs data observability: Understanding the differences and similarities

Data quality and data observability are two related but distinct concepts:

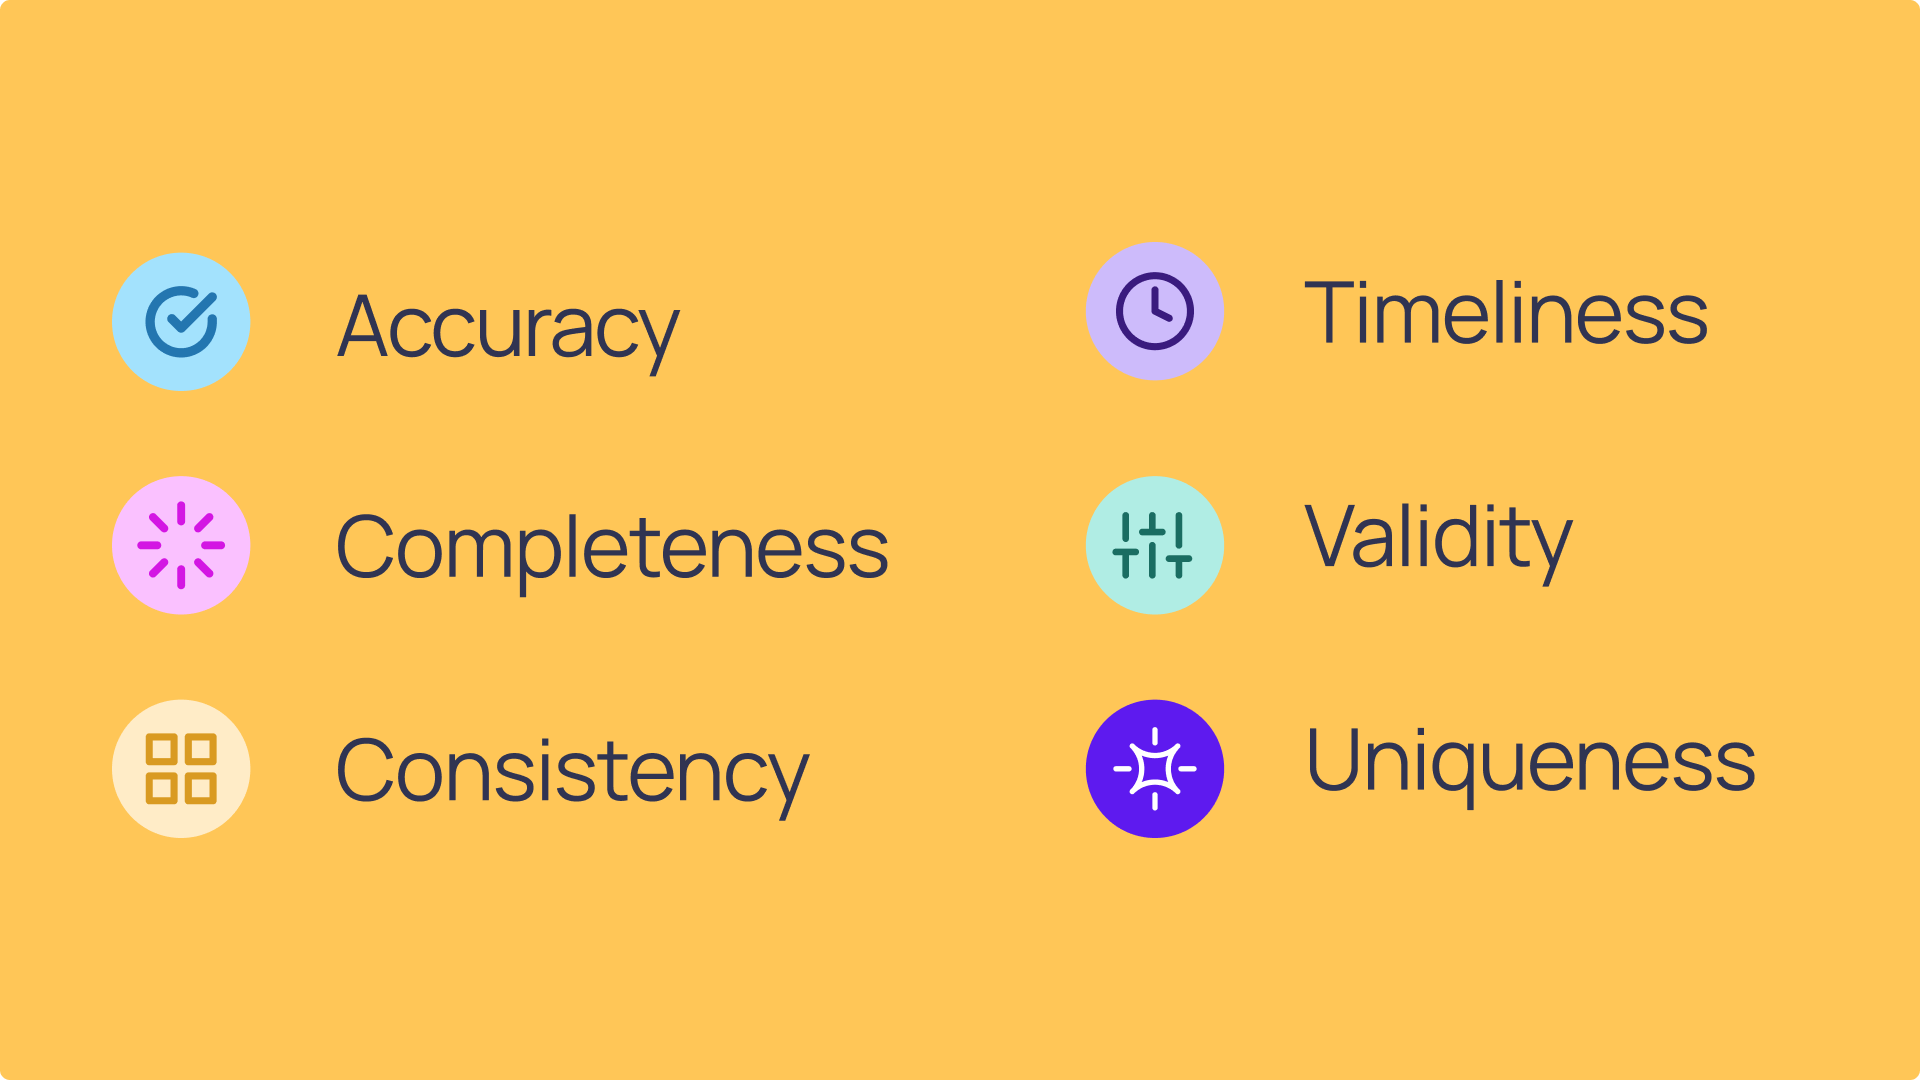
  • Data quality is the degree to which data meets the expectations or requirements of the intended users or purposes. Data quality is measured by various dimensions, such as accuracy, completeness, consistency, timeliness, validity, and uniqueness.
  • Data observability is the ability to monitor, measure, and understand the health and quality of data throughout its lifecycle. Data observability is enabled by various components, such as automated data quality checks, rules, and alerts. This includes data lineage and metadata monitoring. There is also a more granular approach to data observability, called deep data observability. In short, deep data observability lets users monitor data more closely than traditional metadata monitoring. It scans the actual datasets and can detect discrepancies down to the row level.

Data quality and data observability also share important similarities:

  • They both aim to ensure that data is trustworthy, reliable, and valuable for businesses.
  • They both involve data quality metrics, indicators, and scores to quantify and evaluate the data quality level and performance.
  • They both require data quality governance and management to define and implement the data quality standards, policies, and processes.

The ultimate guide to data quality

Read the guide

Ensuring full data trust extends beyond observability

While observability keeps data health in check, unwavering confidence in data demands more. Data observability is crucial for maintaining the quality and health of your data throughout its lifecycle. It helps us quickly identify and address any inconsistencies, errors, or anomalies. But for full trust in your data, it’s essential to fill the gaps left by observability alone. Users still need detailed information about your data’s usability, structure, and rules.

Build deeper data trust with lineage and catalog capabilities

Understanding the flow and transformation of data across your organization is the first step toward a cohesive data culture. Data lineage provides this insight by mapping out the data journey, clarifying how data moves and changes from point A to B. This transparency makes it easier to understand the root cause and impact of data issues—ultimately opening up a quicker path to resolution.

With a firm grasp of data lineage, introducing a data catalog becomes a natural next step. It serves as a comprehensive directory that further demystifies the origins and uses of your data. It's a simple yet powerful way to equip your teams with the understanding needed for sound decision-making, while also staying compliant with industry standards.

By focusing on data observability, lineage, and catalog, you create a transparent environment where everyone understands the data they're using. This isn't about just managing data better—it's about shaping a culture that uses data as a powerful tool for smart growth and solid decision-making.

TL;DR

To recap, here are the main points we covered in this post:

The impact of unresolved data issues grows over time

  • When data isn't accurate, complete, consistent, or current, it directly impacts a business's ability to perform and make sound decisions. 
  • The impact of bad data quality snowballs over time, potentially leading to operational headaches, unhappy customers, and risks around compliance.

Data issues have many causes and measurements

  • Data quality issues can stem from a range of sources, whether it's numeric anomalies, manual input mistakes, issues with software integration, sensor errors, unusual transaction patterns, or shifts in how data is distributed.
  • By proactively monitoring these areas, you can head off many problems before they affect your data's quality.

Data observability keeps your data health in check

  • Data observability is key to keeping your data health in check. It enables you to diagnose, trace, troubleshoot, and predict issues in real time. 
  • It offers the visibility, accountability, and actionability needed to assure data integrity and compliance.

Complete data trust requires advancements beyond observability

  • Data lineage lets you grasp how data flows and transforms across your organization, the root cause and impact of data issues, and how to solve them faster.
  • A data catalog builds on this, offering a clear index of data's origins and applications, empowering informed decisions and compliance.

In conclusion, data quality isn't a luxury; it’s essential to becoming a data-led business. A constant focus on data health lets companies move forward confidently and accurately. For deeper insights on maintaining reliable data, check out our comprehensive data quality guide.

If bad data is something you’ve experienced, we’d love to hear from you!

Talk to us