Okay, so your organization has just decided to bring in a data quality and observability tool, that’s great! More effective decision making by increased data trust. Quicker time to detection and time saved with the help of nifty root cause analysis features. And perhaps best of all, less of “Are you sure these figures are right?” type of questions from disgruntled executives looking at your dashboard, or from some other data consumer consuming the data you are serving.
These are all promised outcomes by integrating a Data Quality and Data Observability tool to your data stack. However, it all rests on the premise that you have the right data validations in the right place. So where should you start? What rules/checks/monitors/validations* should you set-up first, and on which sources?
In this article we’ll discuss some best practices on how to effectively get started with the most meaningful validators, so you, your team and your organization can realize the promised outcomes as fast as possible.
*I work at Validio, a nameplay of ‘valid I/O’, you can guess which name we prefer :) Hence I’ll henceforth call it ‘validations’ in this article
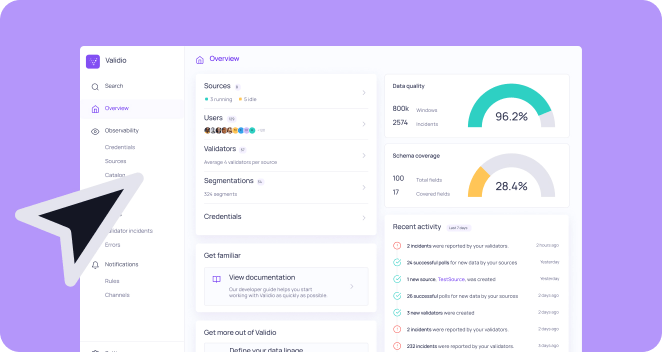
What tables to check
There are three simple dimensions which you can use to identify what tables you should start applying data validation on:
- Business criticality
- Compliance and regulations
- Data Utilization
1. Business criticality
Ultimately the data you store, move, transform and/or analyze, serves a purpose. Not all data is created equal. Some data, the business just cares more about than other data. Start there!
If you’re a Data leader, you should have a good understanding of your most business critical data. If you have a more specialized technical role in your team and need some pointers, here’s some typical signpost to look for:
2. Compliance and regulations
Easy one! Banks, Pharma, IT Security. GDPR, HIPAA, PII. You probably have a good sense if this applies to your organization and if you have any data that you need to keep an extra eye on due to regulatory reasons. Good place to start lest you get any pesky fines.
3. Data Utilization
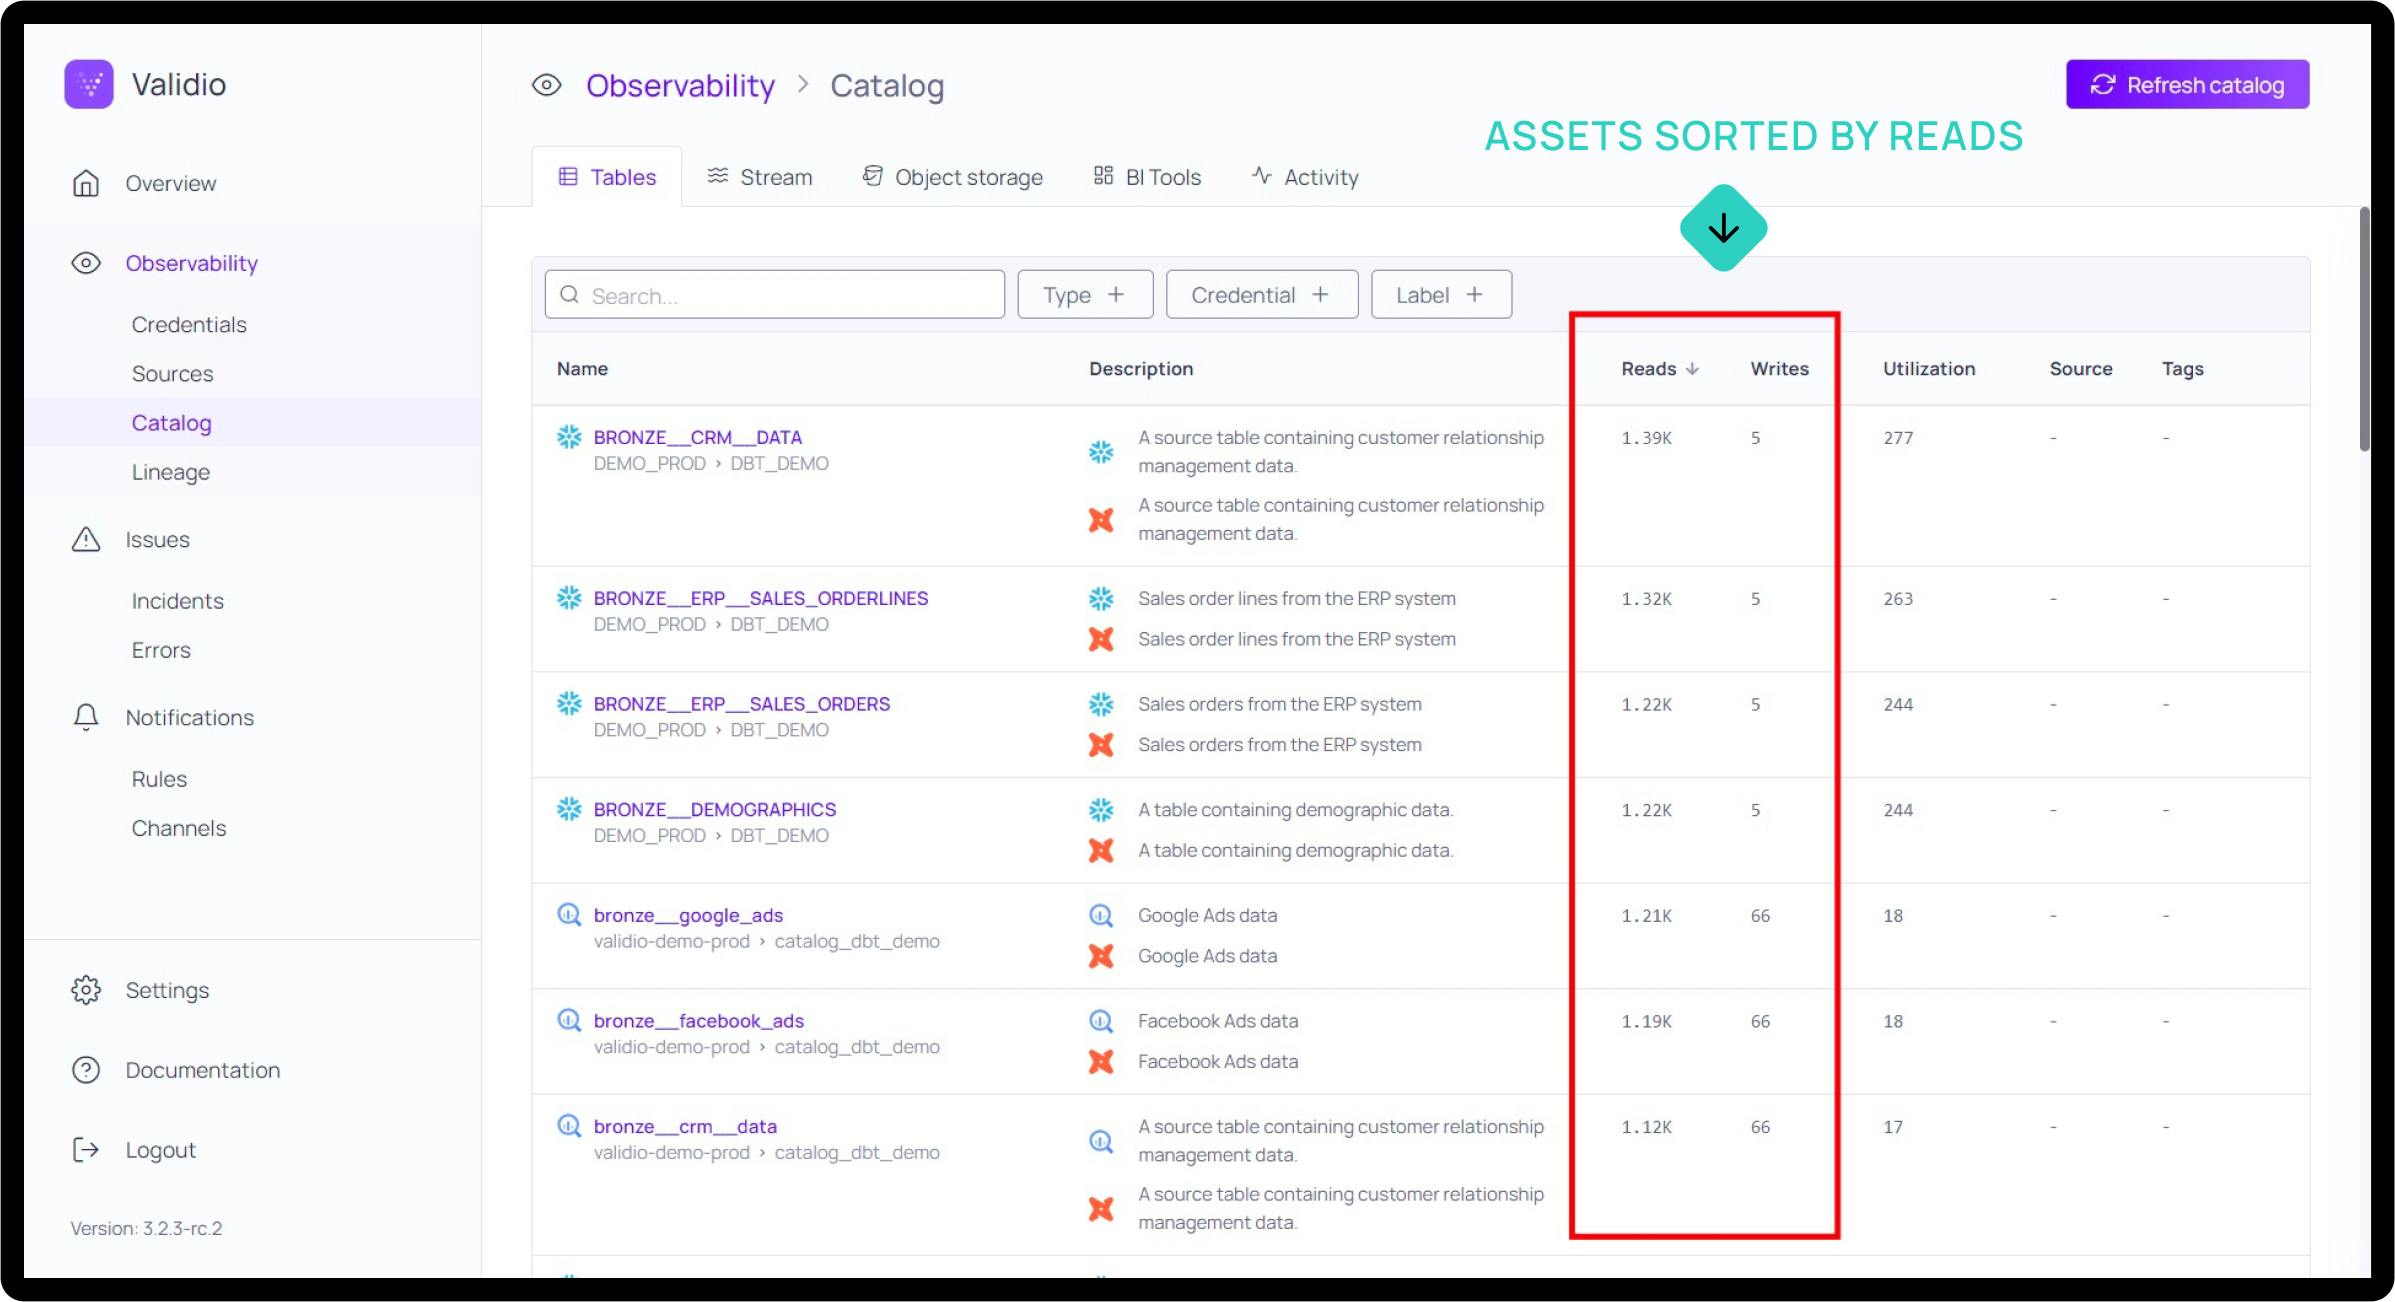
To be fair, this is just another version of our bullet (1), a data driven proxy to business criticality you could say. If you have a Data Catalog today or any other data tool (like Validio) that tracks usage meta-data such as #table reads and #table writes, you can easily get an overview of the most used tables and data. Rarely a bad place to start.
What validations to set-up
You’ve now found your tables, what validations should you then set-up?
A simplified way to think about it, is two types of validations:
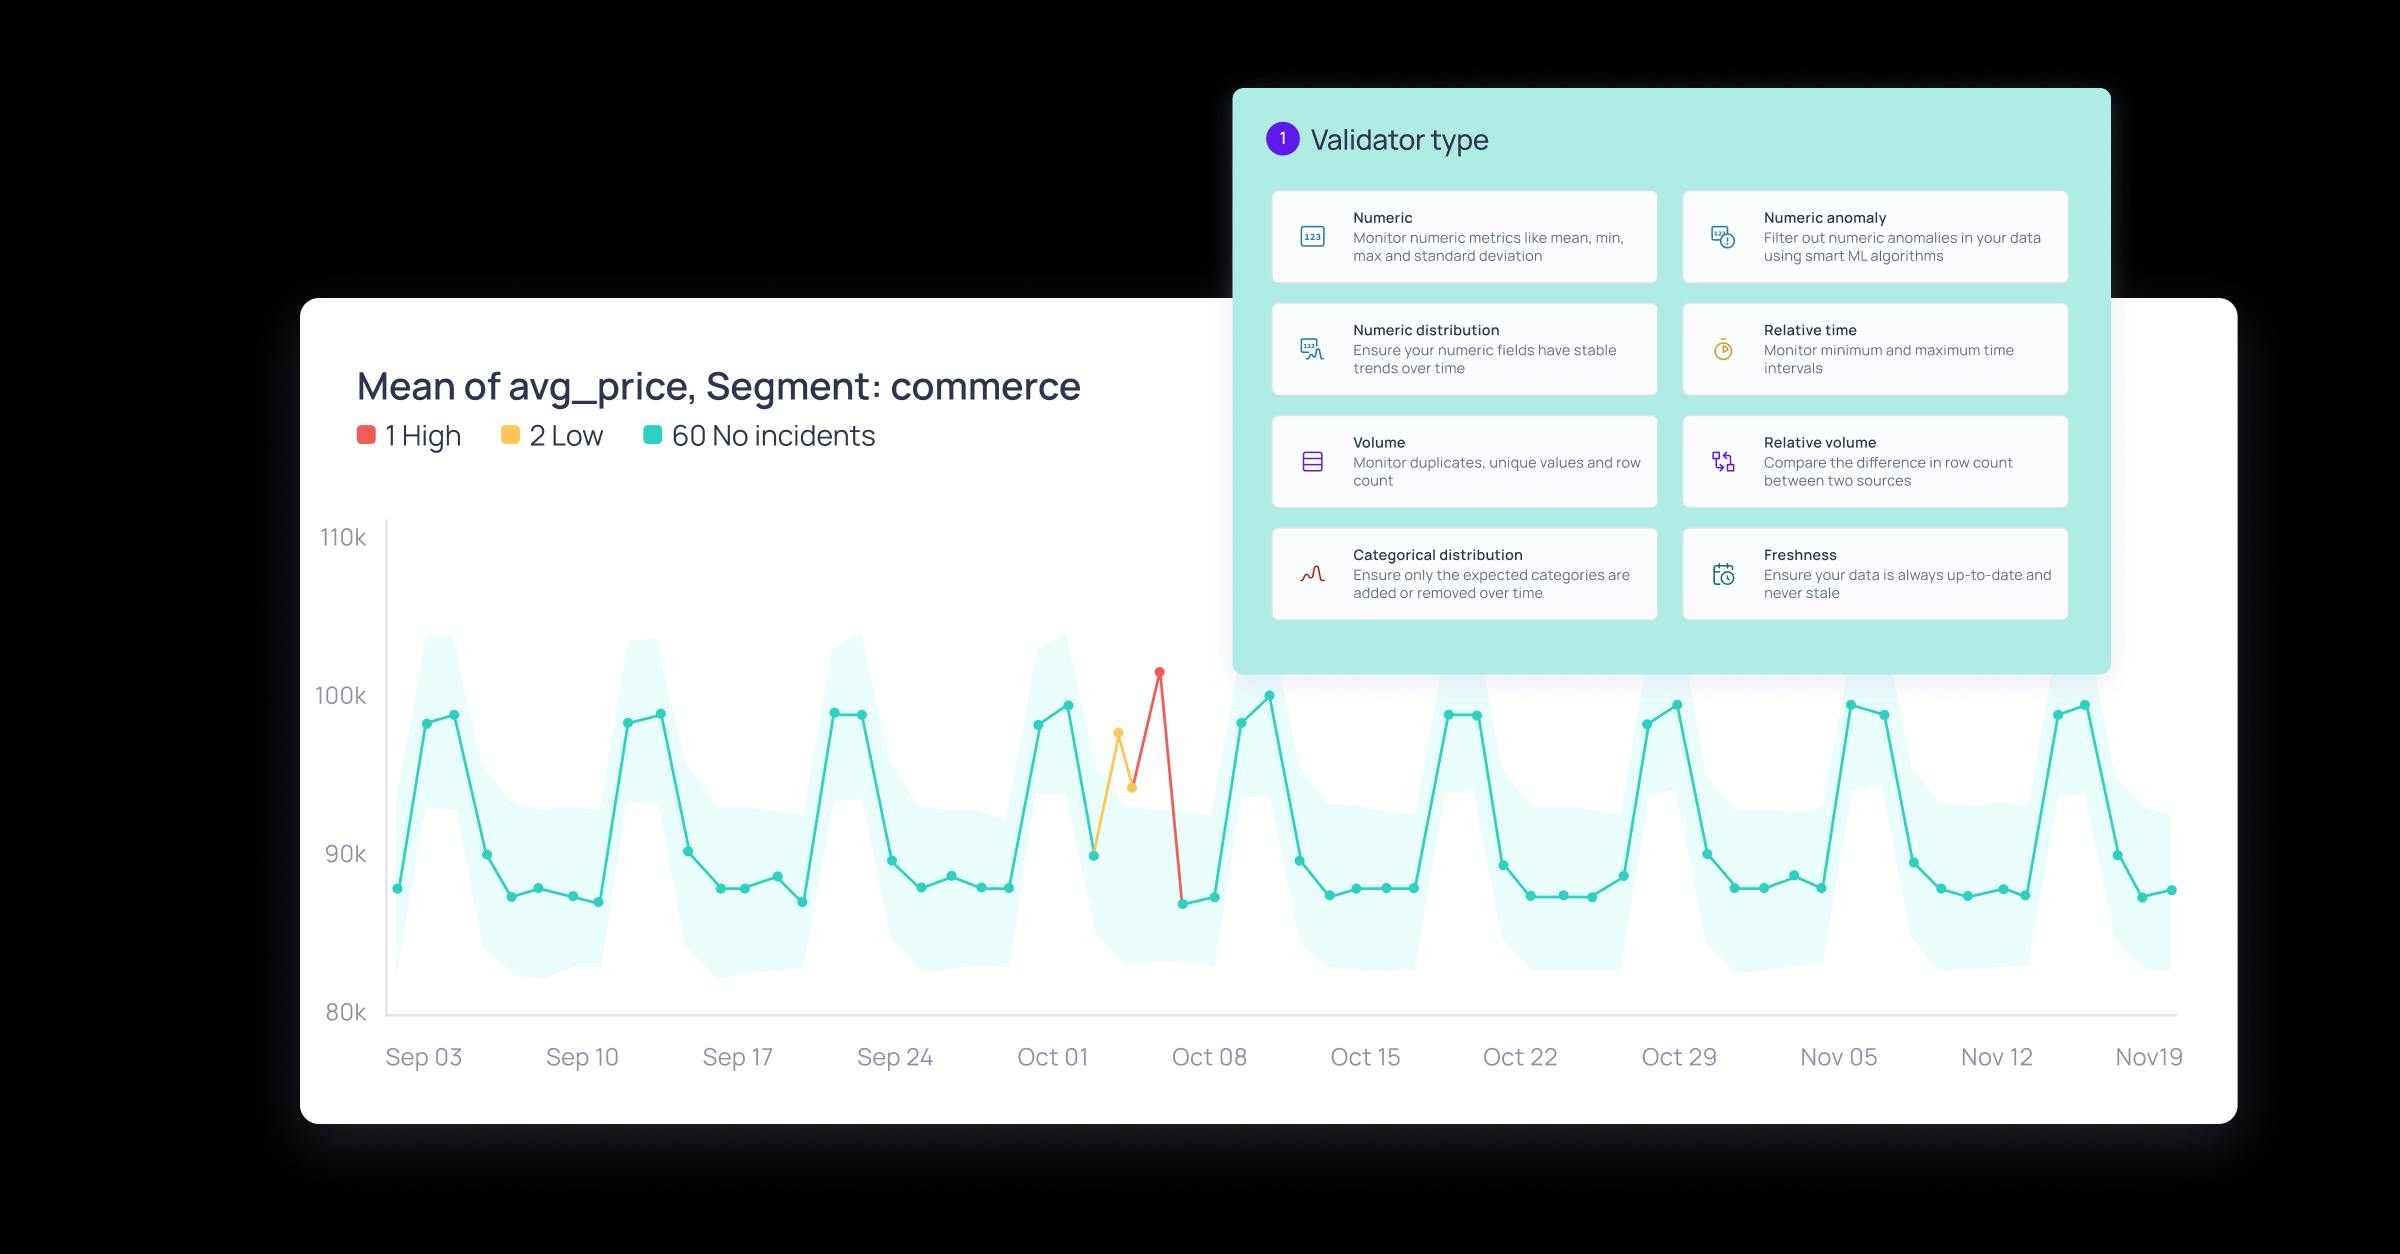
- Technical data quality and observability validations: your hygiene validations such as null %, row count and freshness
- Business validations: validate the actual value of the data. Let’s say your organization has KPIs or metrics such as app usage data or transactional sales data that powers some dashboard. Validate deviations in the values of this data.
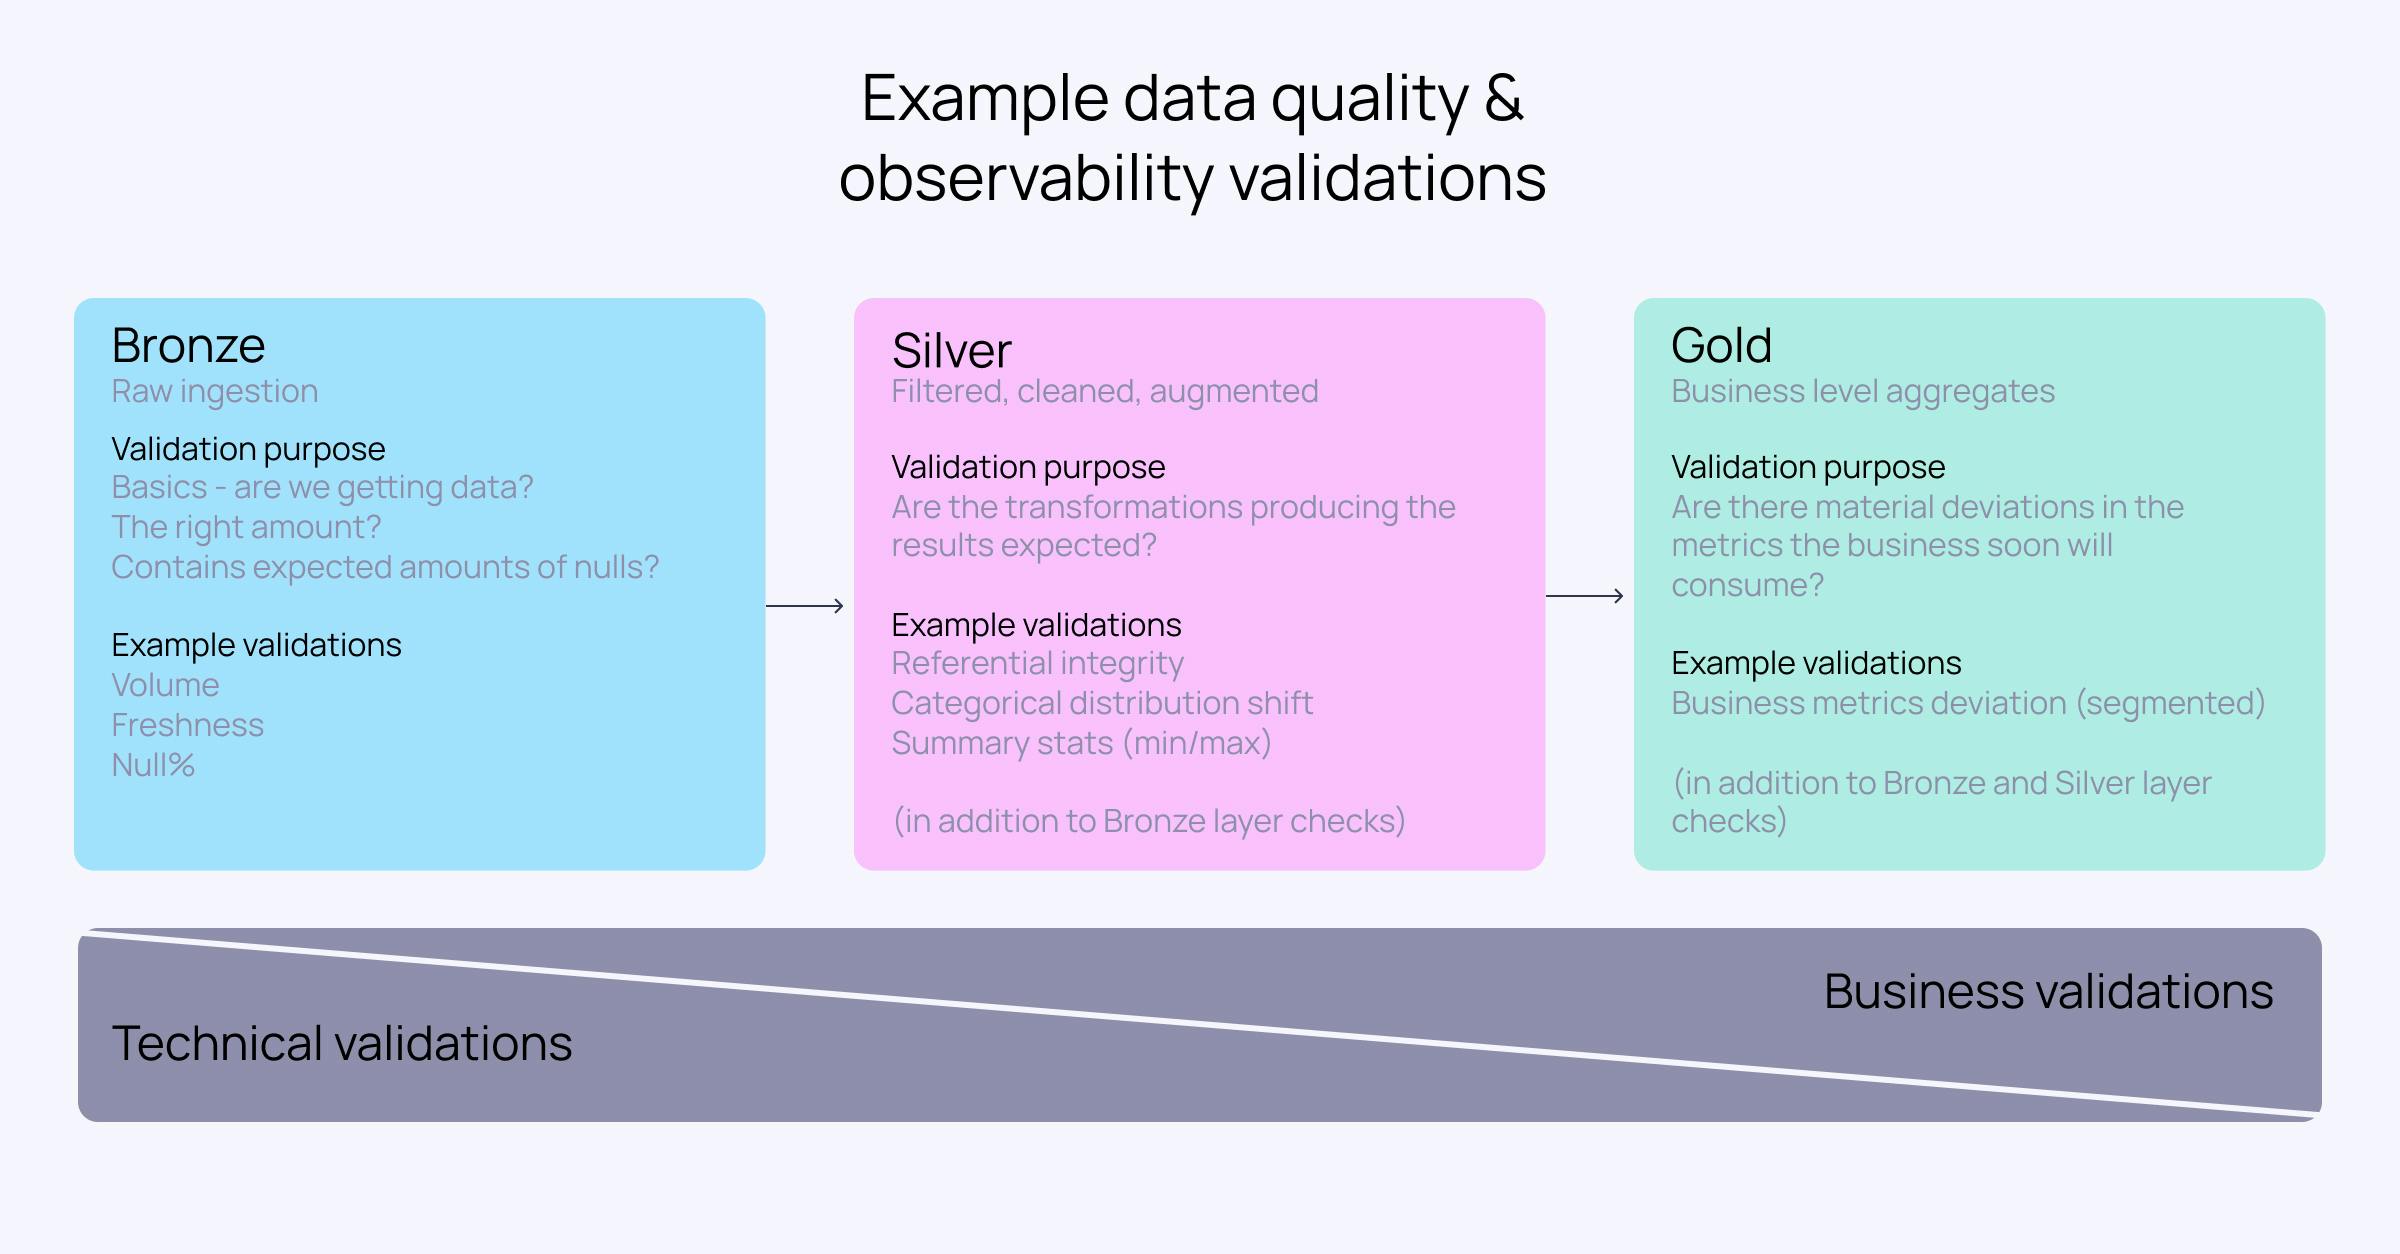
Rather than being an exhaustive example of all types of validations, think of the above two bullet points as two ends of a spectrum. In between you could have other validations such as duplicate, referential integrity, string formatting, distribution checks etc. Let us illustrate with an example.
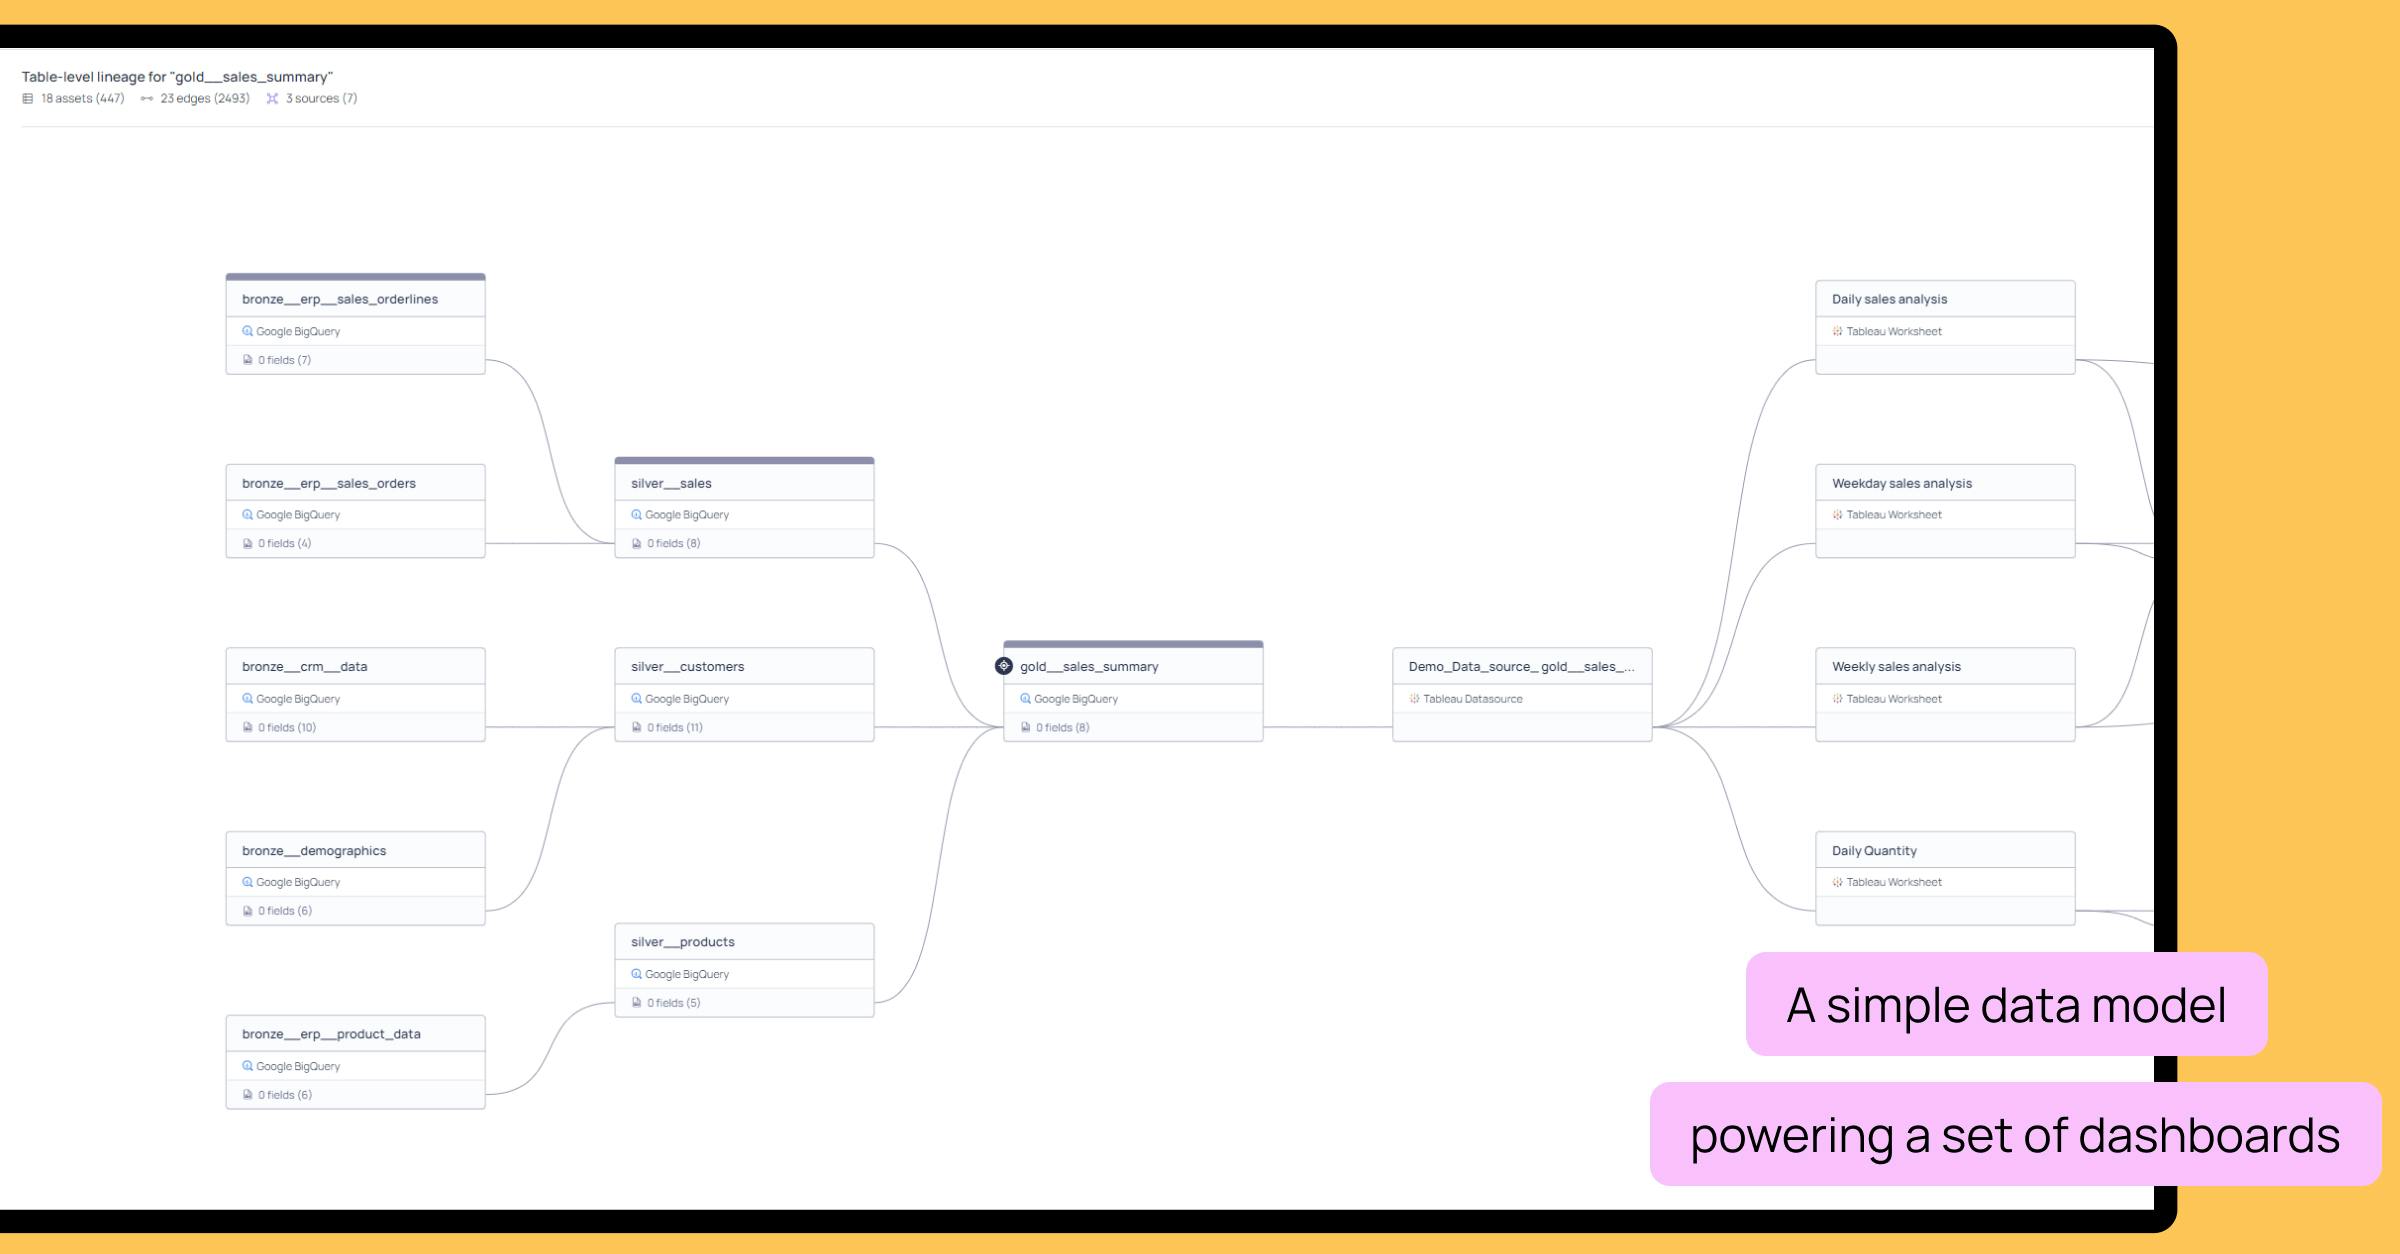
Let’s say your organization follows a medallion data modeling structure. Whether you call it bronze, silver, gold tables or landing, staging, curated tables, or something else - below principle still applies.
Here’s how you could think about the types of validations you can set-up across your lineage graph. In this example, we’re assuming a BI/reporting/dashboard use case:
Remember the “Are you sure these figures are right?” question from the disgruntled executive we mentioned in the beginning? Ultimately, an anomaly in the executive’s metrics, say a drop in his sales numbers, can broadly speaking be caused by two reasons:
- Technical problems - join went wrong, pipelines failed etc.
- It is an accurate representation of reality
If you have set up your validations in a way like the above example, next time you can quickly get comfort in which of the two reasons caused the anomaly.
If business metric validations in the gold table are blinking red, while all the technical validations check out in bronze and silver; perhaps the disgruntled executive should spend less time nagging you and your team and spend more time figuring out what to do with the tanking sales numbers.
What you SHOULD NOT do
Lastly, here’s an anti-pattern I’ve seen throughout the years that just isn’t great - Spray n Pray. Some tools out there allow you to do one-click-set-up validations on everything under the sun, or at least everything in your data warehouse. This is the antithesis of the three dimensions of table prioritization, and also why we walked through the example in the previous section - you want to be thoughtful of what types of validations you set-up where.
Have you ever joined a Slack channel like #random, #memecave, #InsiprationalQuotesOfTheDay, that you initially thought was a good idea but you just ended up muting after a while? That’s exactly what’s going to happen if you indiscriminately start applying validation on all your data - you will drown in irrelevant notifications and learn to mute/ignore them, defeating the purpose of having validations in the first place.
With that said, we’re working on a second article on how to minimize alert fatigue and maximize signal to noise ratio when it comes to data quality and observability alerts. Stay tuned for that one!