Platform

Data Quality & Observability

Detect anomalies anywhere in your data, in real time

Lineage

Get to the root cause and resolve issues quickly

Data Asset Insights

Discover data assets and understand how they are used

Discover the product for yourself

Take a tour
Pricing

Learn more

Customer stories

Hear why customers choose Validio

Blog

Data news and feature updates

Reports & guides

The latest whitepapers, reports and guides

Events & webinars

Upcoming events and webinars, and past recordings

Heroes of Data

Join Heroes of Data - by the data community, for the data community

Get help & Get started

OfferFit take their ML models to the next level with Validio

Read the case study
Guides & Tricks

A guide to avoid alert fatigue from your Data Quality and Observability systems

August 9, 2024
Richard WangRichard Wang

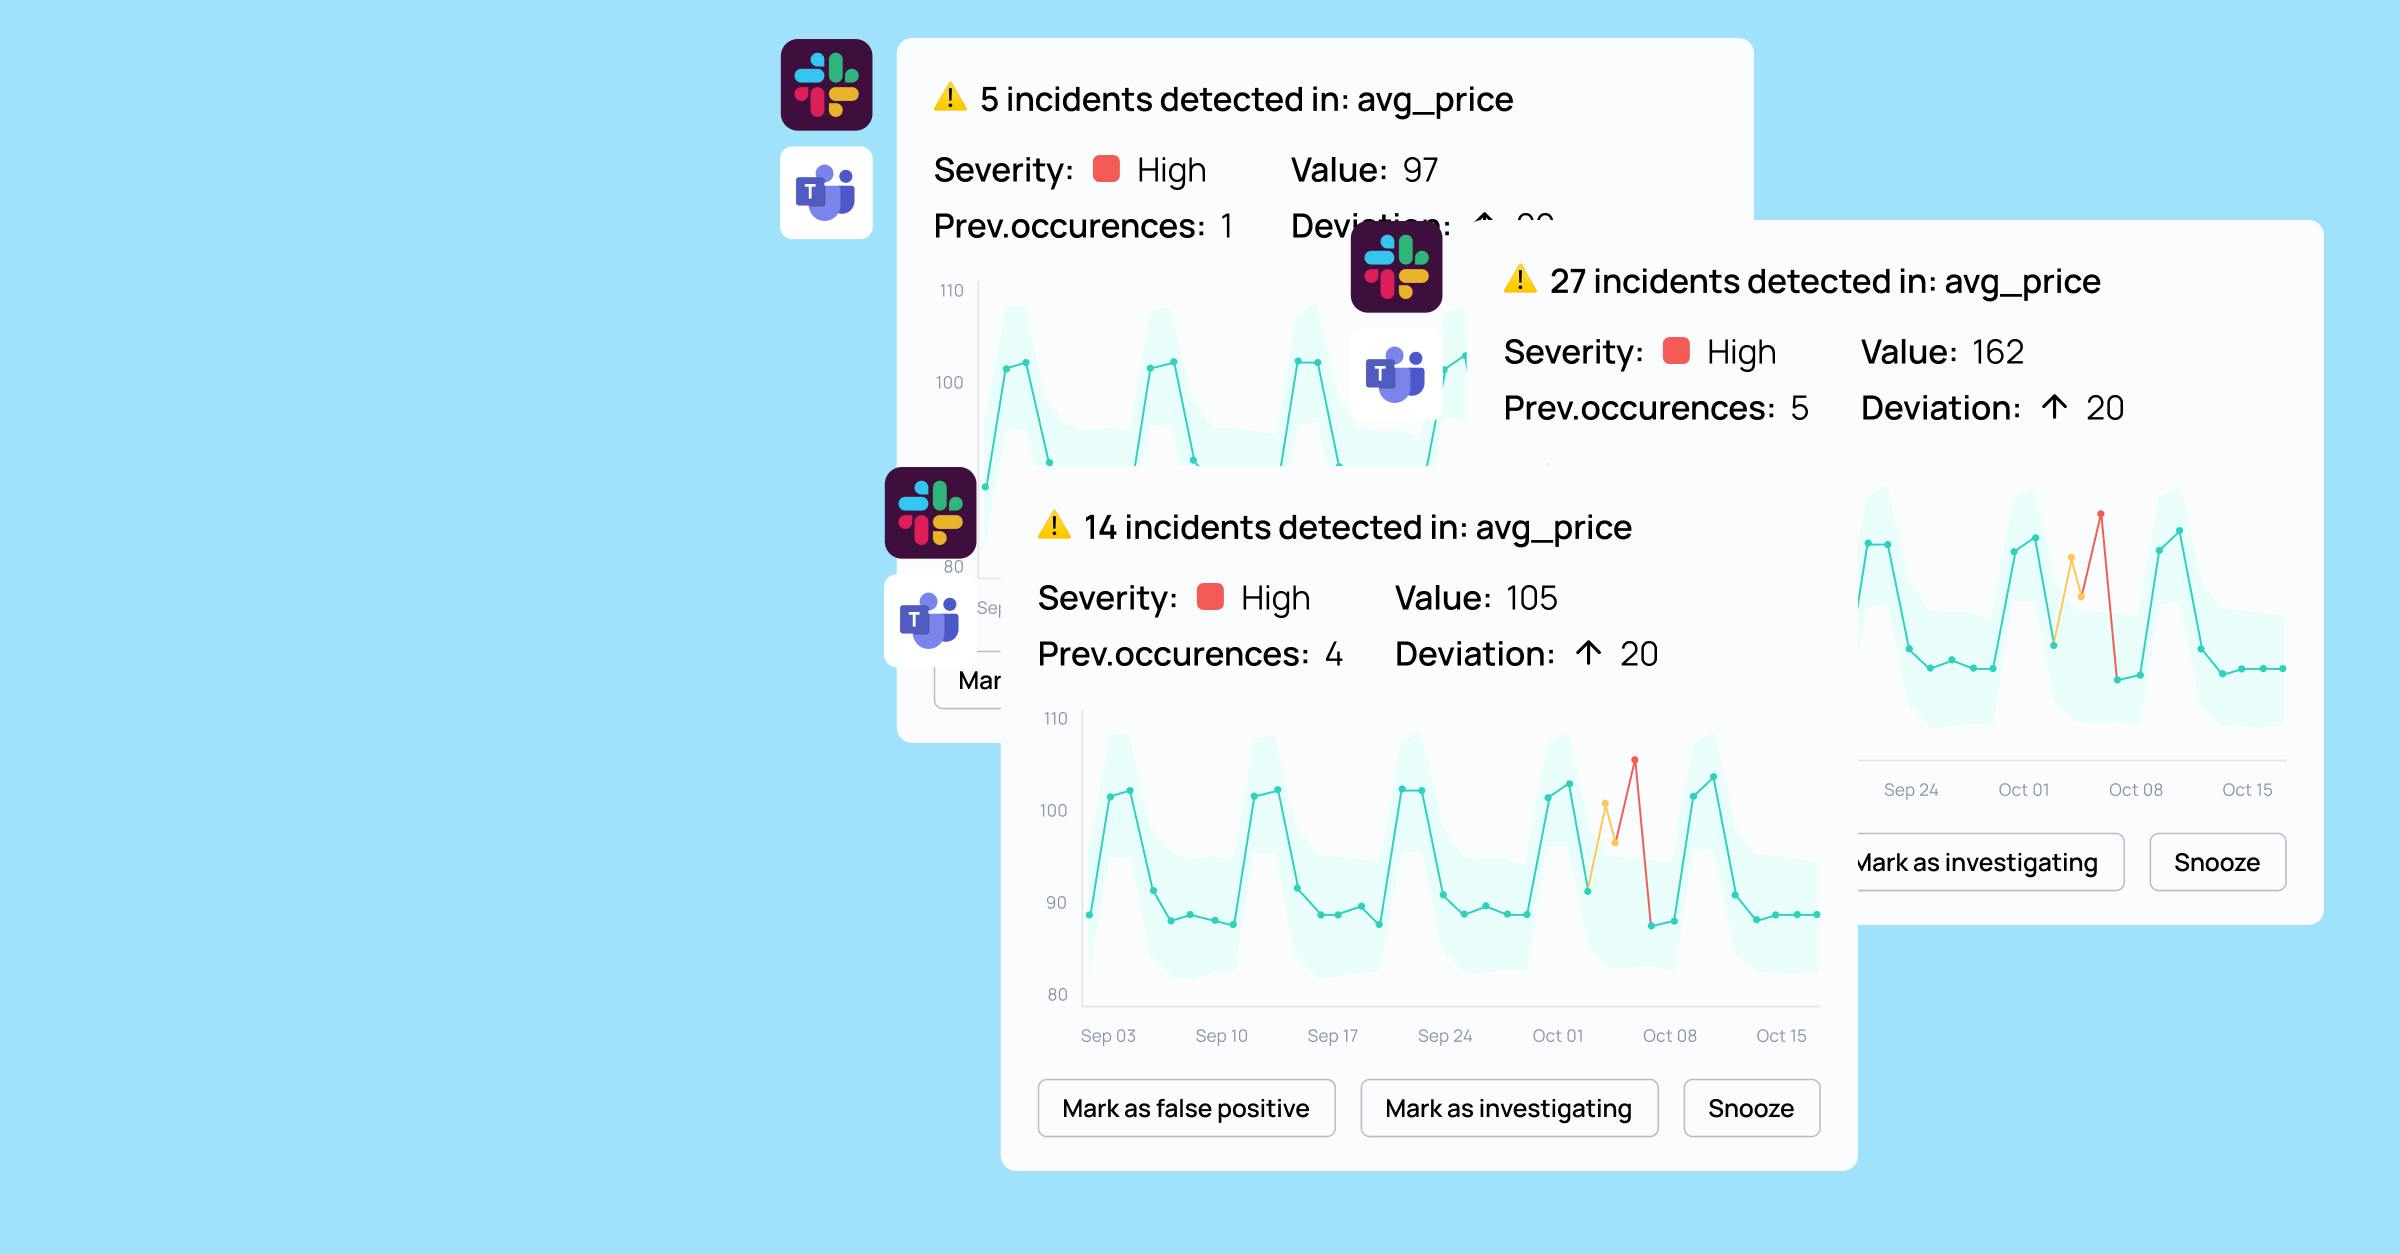
One of the biggest inhibitors to widespread adoption of any monitoring tool (not only data quality and observability tools) is the risk of finding yourself drowning in alerts that aren’t relevant. While it’s important that any tooling you adopt includes the necessary features to facilitate actionable and effective alerts, there are a few best practices you and your team can follow to further mitigate alert fatigue. 

We’ve already walked through a few best practices around setting up data quality validations. The first step to actionable alerts is to set up the right validations at the right place, if you haven’t already - our suggestion would be to start there before reading this guide. 

Let’s get started!

The Overview

The four areas to keep in mind when optimizing for signal to noise ratio are:

  1. The right thresholds: be thoughtful of the sensitivity and what type of thresholds you apply to avoid false positives.
  2. The right channels and the right people: far from everyone needs to get alerted for everything, make sure the right people get the right alerts. No less, no more.
  3. The right timing: not all incidents require immediate action, ensure P0 notifications are sent out immediately, less urgent incidents can be addressed at a later time.
  4. The right workflow: to the extent possible, integrate data quality and observability incident management workflow to existing workflows and processes.

This is by no means rocket science at the end of the day, but it hopefully serves as a helpful checklist to make sure you’ve covered all the aspects. Let’s go through and expand on each bullet.

1. The Right Thresholds

Ultimately, the thresholds you define on your validations will define what is considered an incident and what’s considered business as usual. Out of these incidents, you’ll typically choose which incidents should be sent out as a notification and customize those settings. The idea here is to address the first part; optimizing the number of incidents generated in the first place.

In general, you’ll have two types of thresholds:

  1. Manual thresholds - from fixed thresholds, ‘alert me if the number of records falls below 1,000,000 per day’, to difference thresholds, ‘alert me if daily active users decrease with 10% three days in a row’.
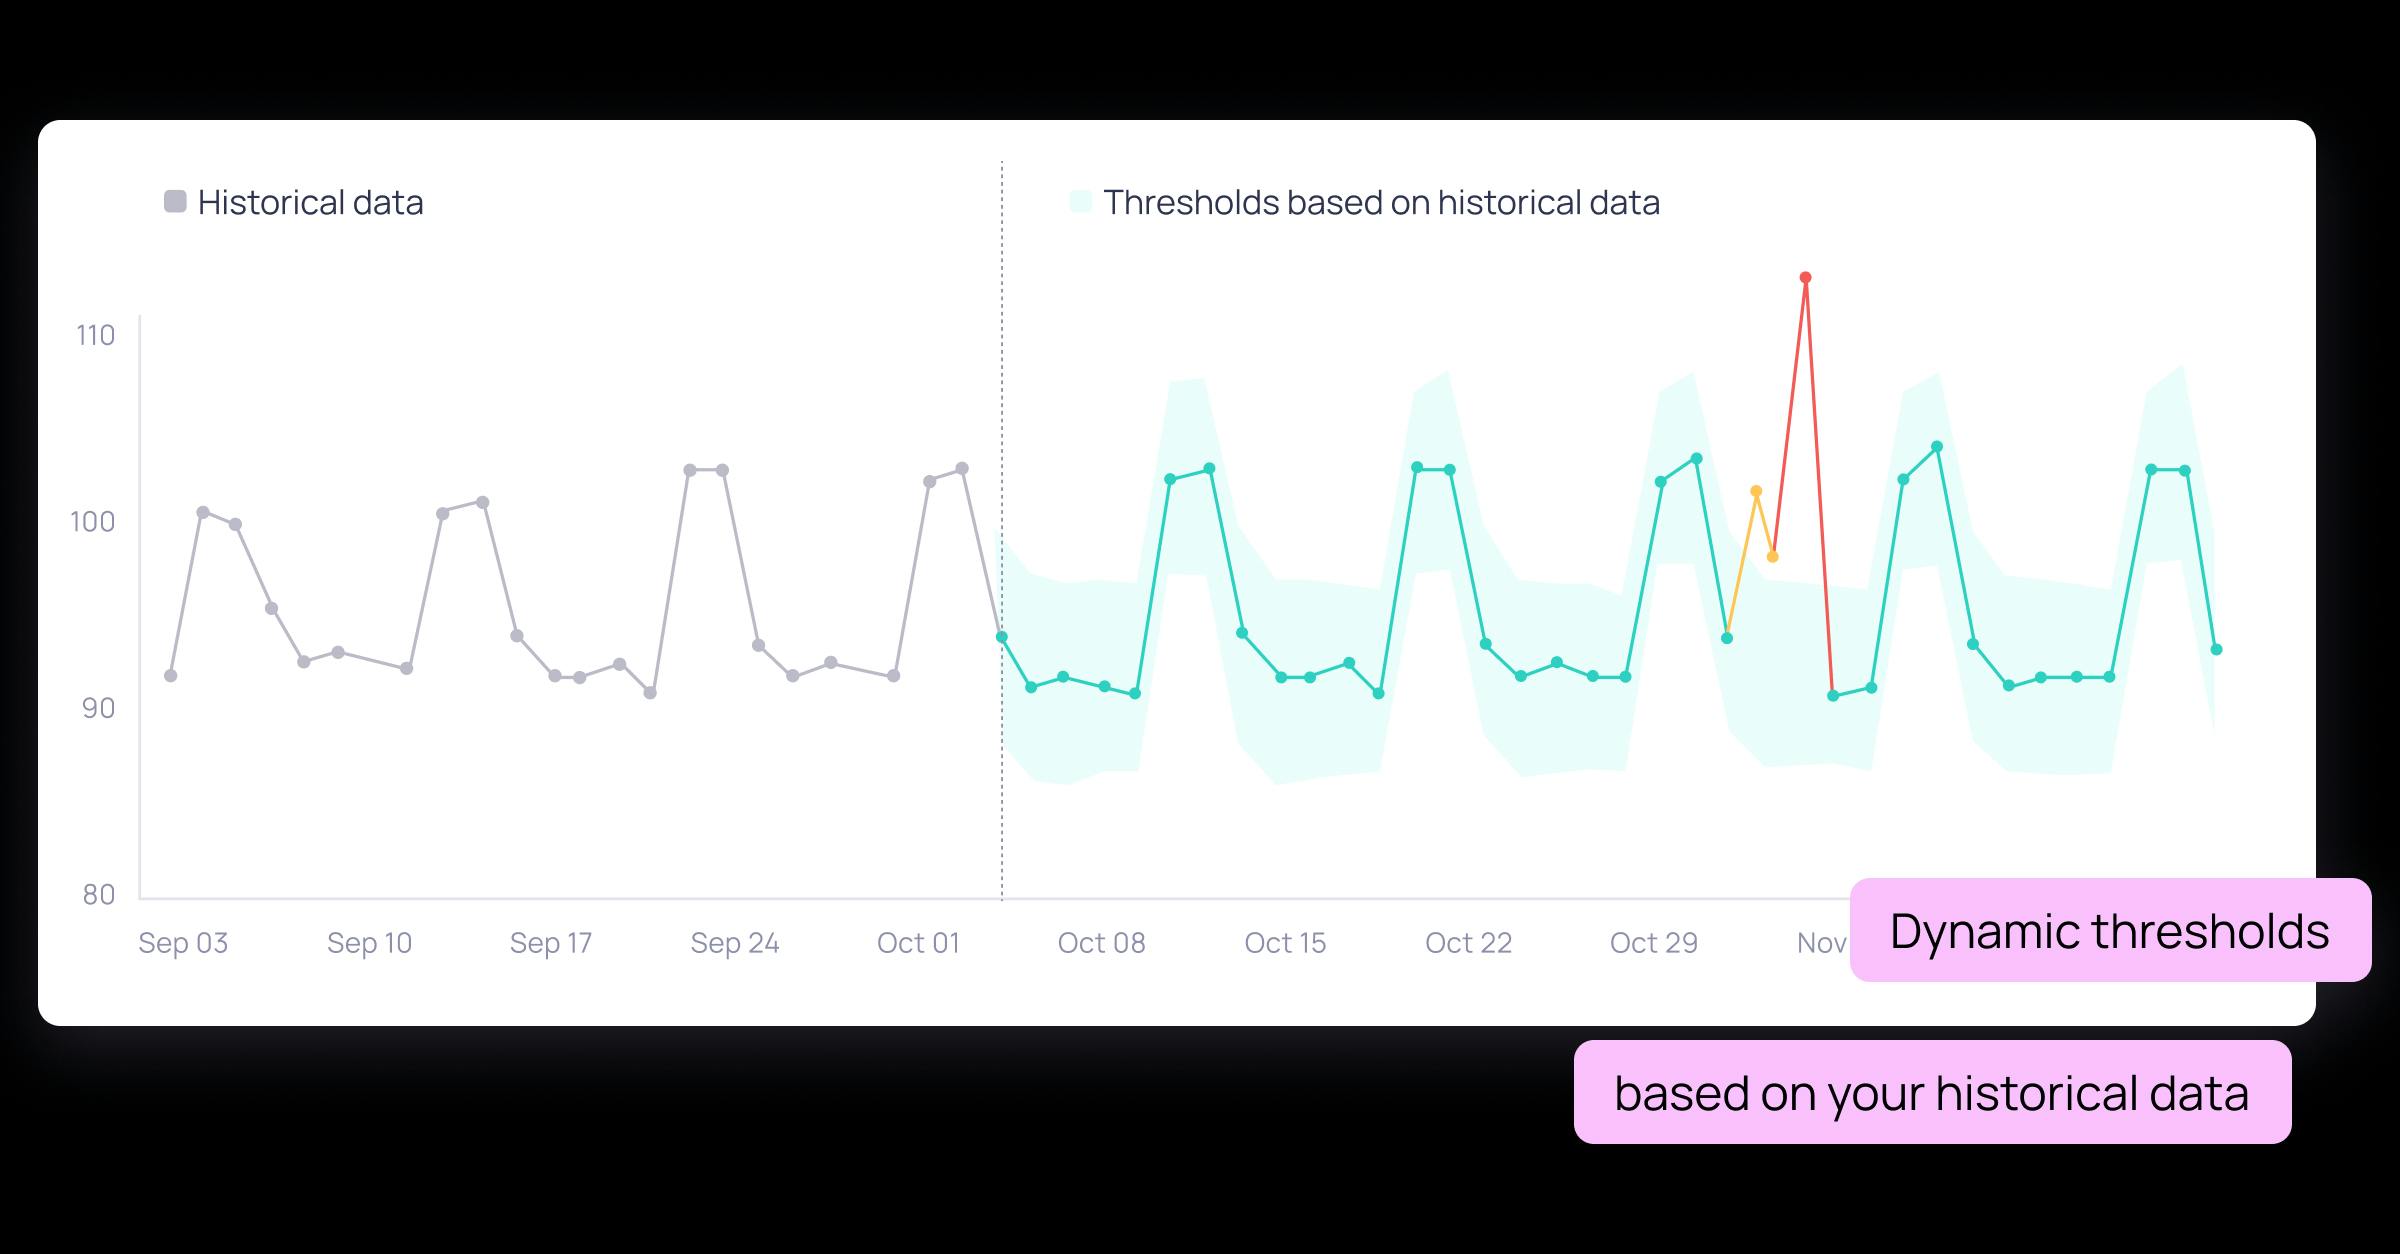
  2. Dynamic thresholds - ML driven thresholds that are automatically defined based on historical data, adapting over time
Data observability dynamic thresholds

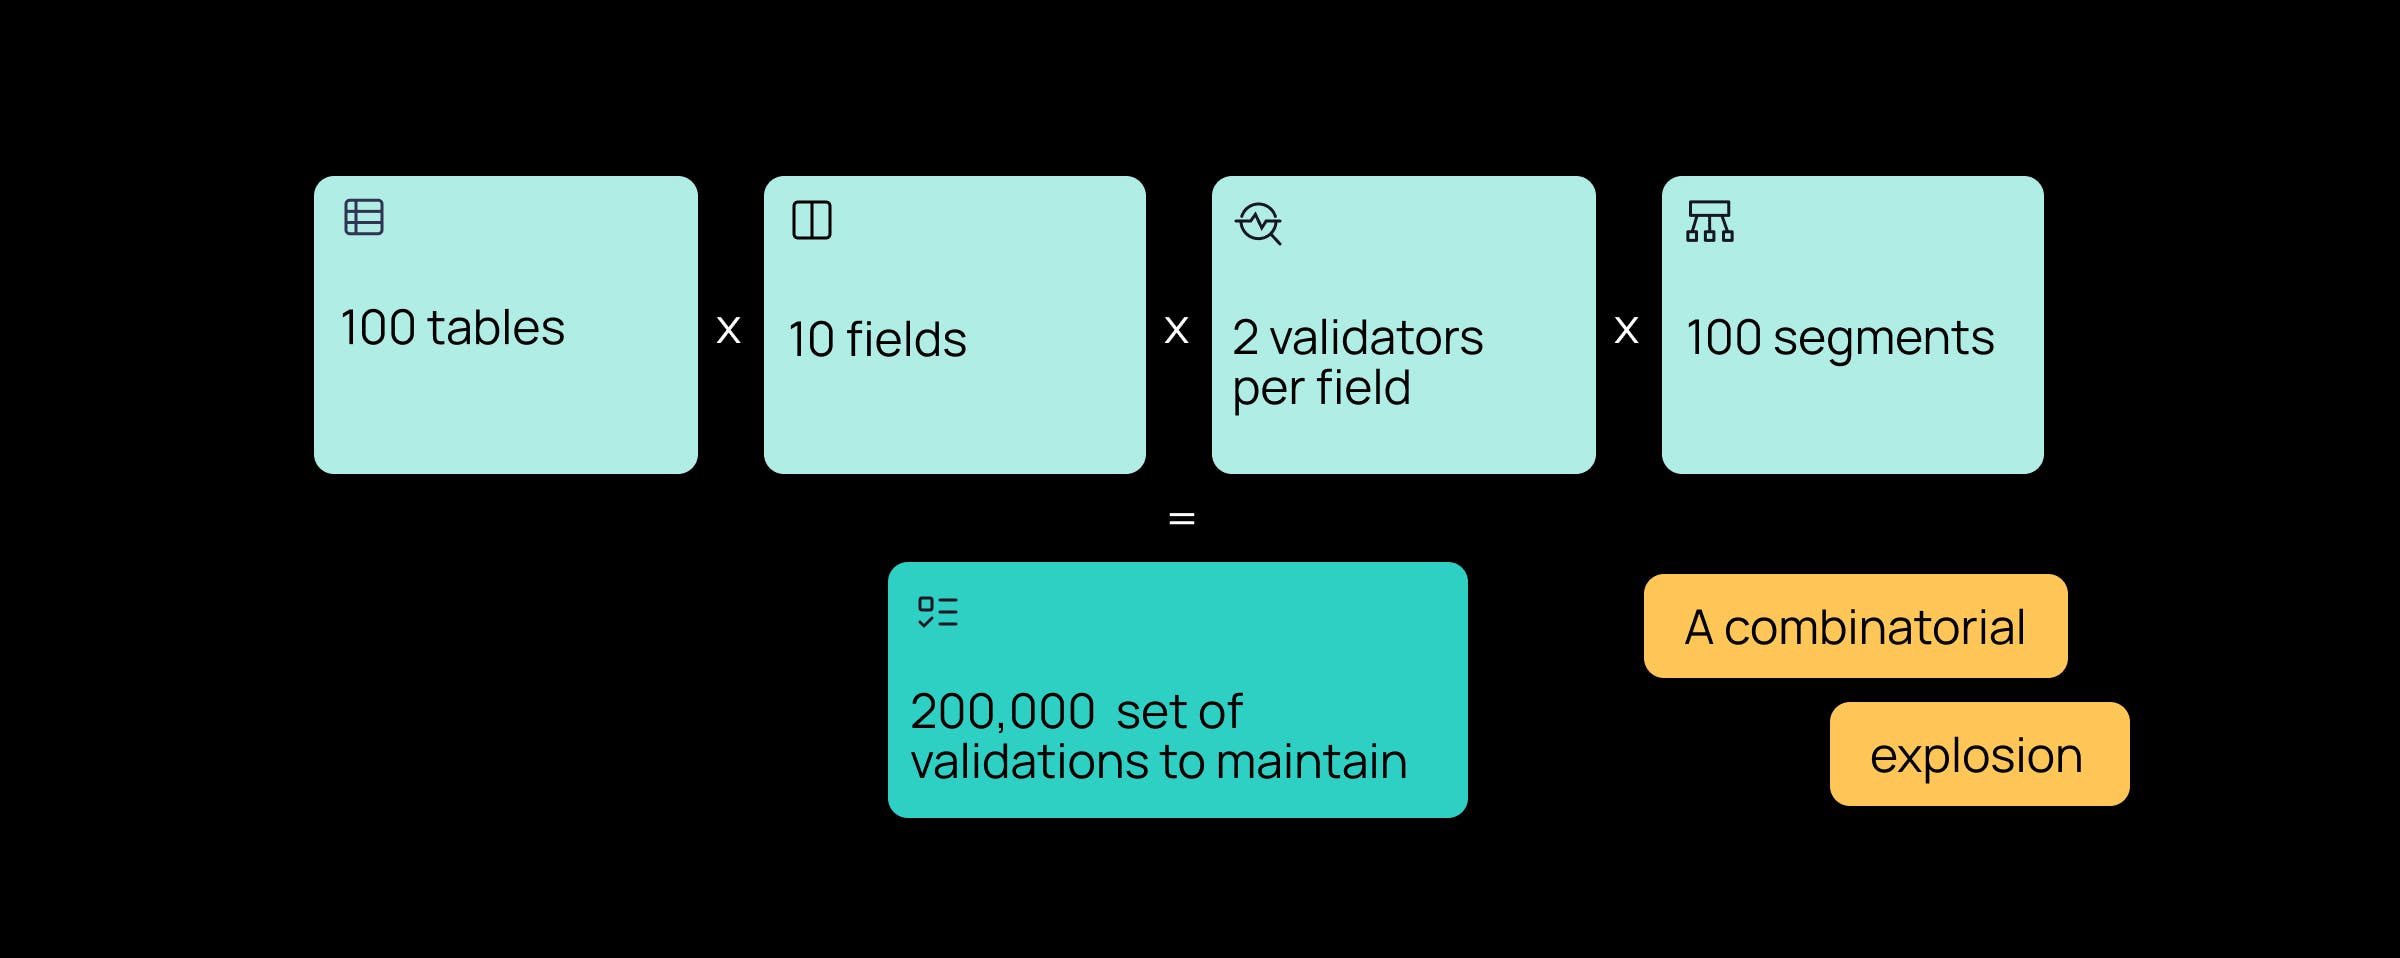
To the extent possible, rely on dynamic thresholds on the majority of your validations. Manual thresholds are great when there are explicit rules known to the business, but can be incredibly cumbersome to define, and even more exhausting to maintain as the rules go stale. To illustrate this, let’s say you have a set-up that looks like this:

Illustration of the challenge of setting up manual data quality rules

In our experience, when you have so many manually defined validations, they quickly get stale and you’ll be sure to get plenty of false positives. Let's say you have a volume (record count) validator - what happens with tables that organically grow? It will quickly become very cumbersome to keep up with the false positives, not to say updating and maintaining these validations over time. Hence why you want ML driven dynamic thresholds that adapt themselves over time for validations at scale.

Features to look out for to ensure right amount of incidents:

  • Automatic ML-driven threshold - make sure to evaluate its generalizability to different type of data, adjusting for trends and seasonality, as well as its ease of use
  • Manual thresholds - for the few manual thresholds you do have, ensure there’s enough customizability for you to be as granular and specific as possible to avoid false positives
2. The Right Channels and the Right People

Changing context and tools is annoying, and so is getting notifications about quality and observability incidents you don’t care about. Make sure that you route incidents to people who actually care about them. Use built-in features such as tags and owners to ensure the right people get the right alerts, in the right place (e.g.right Slack channel).

Does the entire Data Engineering team really need to get alerts of every single table? Can you divide the incidents based on ownership or perhaps function? Perhaps even someone else outside the Data Team should be the primary subscriber to notifications? This will ensure that every incident gets viewed and acted on by someone who cares about that particular incident.

Added bonus! There’s a hidden data platform adoption driving mechanism if you are thoughtful about who gets which alert that we’ve repeatedly seen with our customers. Many data teams face the same challenge after rolling out a new Data Platform to democratize data: few business users actually end up using the tool.

Here’s the trick: let’s say you have a Head of Marketing who has her/his important KPI:s and metrics (or any business colleague who has tracked metrics they care about). This person also happens to be an avid Slack user. If one day, this person gets a Slack alert saying ‘[Marketing’s #1 KPI] just dropped by 35%’ - you bet the Head of Marketing would click the link entering the Data Platform tool to figure out what was going on. We’ve seen a lot of cases where adoption of new data tools start this way.

Features to look out for to route notifications to the right people and channel

  • Check the granularity of notification controls and evaluate if it’s able to route notifications based on tags, owners, tables, segments etc.
  • Make sure your notification channel(s) of choice is supported - Slack, Teams, Email etc.
  • For the added adoption bonus: easy to use UI for less technical users
3. The Right Timing

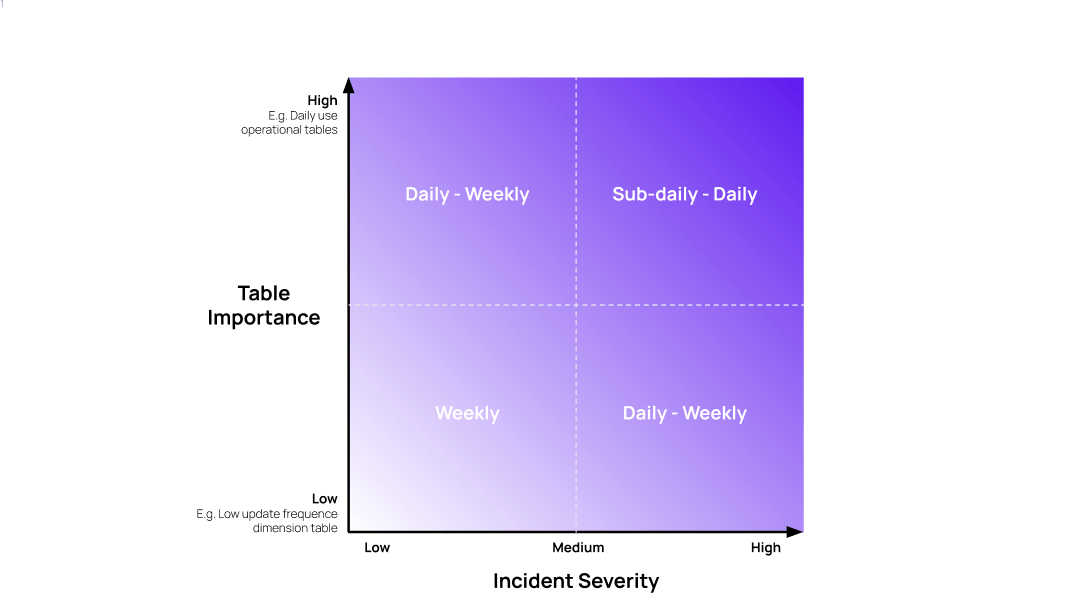
Not all data quality and observability incidents are equally important. Some tables might be less important than others or some incidents may only slightly exceed the validation threshold, i.e. a low severity incident.

Use this information to govern how often you should be alerted. A simple way to think about it is illustrated in the diagram below - set up alert frequency based on table importance and incident severity.

Added bonus! For the less time sensitive tables where regardless of severity, you don't need immediate alerts, you can adjust your polling schedule accordingly and optimize query costs. Let’s say you want daily validation granularity on volume (count #rows per day), but only receive alerts on a weekly basis, you can then set the polling schedule to weekly . The row count for the seven days will be calculated by the end of each week, thus reducing the number of queries 7x. 

Features to look out for to configure notification timing:

  • Automatic severity classification - make sure the tool you use have an automatic severity classification based on how far outside the thresholds the incident is
  • Polling frequency - ensure you can configure how often a table is polled and consequently how often notifications are sent out
4. The Right Workflow

Lastly, you’ll want to integrate your Data Quality and Observability incident management workflow, how notifications are consumed and acted on, to your existing workflow if any. Most tools out there come with a suite of features to natively handle incidents - however, you want to make sure there’s flexibility to integrate to your existing processes and tools if need be.

This last step is as crucial as the previous three steps. Even if you’ve struck a good balance of number of incidents generated, optimized which users receive what alerts, where they receive alerts and finally, how often - notifications of incidents are ultimately only helpful if they spur action and get addressed. This is why you want to consider integrating Data Quality and Observability incidents into an existing workflow.

We won’t go into details about best practices for the incident management process itself. However, to integrate with your existing workflow tooling-wise, there are a few things to keep in mind:

Features to look out for to support workflow integration:

  • Webhooks - flexibility to consume and integrate notifications the way you want
  • API and SDK:

→ Consume all artifacts generated by your Data Quality and Observability tool programmatically - e.g. pipe incidents to customized BI dashboard if that’s the existing way your organization consumes incidents

→ Allow for more granular logic such as circuit breakers, or interact with the native incident management features programmatically

A checklist to reference

So, as you can see, avoiding alert fatigue isn’t rocket science. It comes down to sending alerts for the right incidents, to the right people and channels, at the right time, acted upon with the right workflow.

All organizations work slightly differently, and while the examples above may not be one-size fits all, in our experience, the starting point we’ve outlined here has served us well as a one-size fits many. Especially from the perspective of a checklist to use and make sure you’ve covered all aspects.

Hopefully this spurred some ideas on how you can think about minimizing alert fatigue. If you have thoughts, questions, or want to learn more - don’t hesitate to reach out to me. You can reach me at richard@validio.io