Data quality — one of the most exciting developments in data engineering
It’s been interesting to follow the development within the broader data quality category during the past 12–18 months. Undoubtedly, one of the most exciting recent developments in data engineering is the emergence of a new class of data quality validation and monitoring tools. In the last decade, companies like DataDog, NewRelic, and Sentry have automated many aspects associated with infrastructure and application monitoring, improving the work lives of DevOps engineers. In the coming decade, a new class of data validation and monitoring tools aim to do the same for data engineers.
Data engineering was the fastest-growing job in tech last year according to Dice’s Tech Job Report and a recent 2022 State of Data Engineering Survey report showcased that data quality and validation topped the list of challenges cited by survey respondents (predominantly data engineers). 27% of the survey respondents were unsure what (if any) data quality solution their organization uses. That number was even higher, amounting to 39%, for organizations with low DataOps maturity.
The report highlighted how all organizations, but particularly startups/scaleups and those in the process of building a data platform, should consider how they will approach data quality and validation early on to avoid major hurdles later down the road.
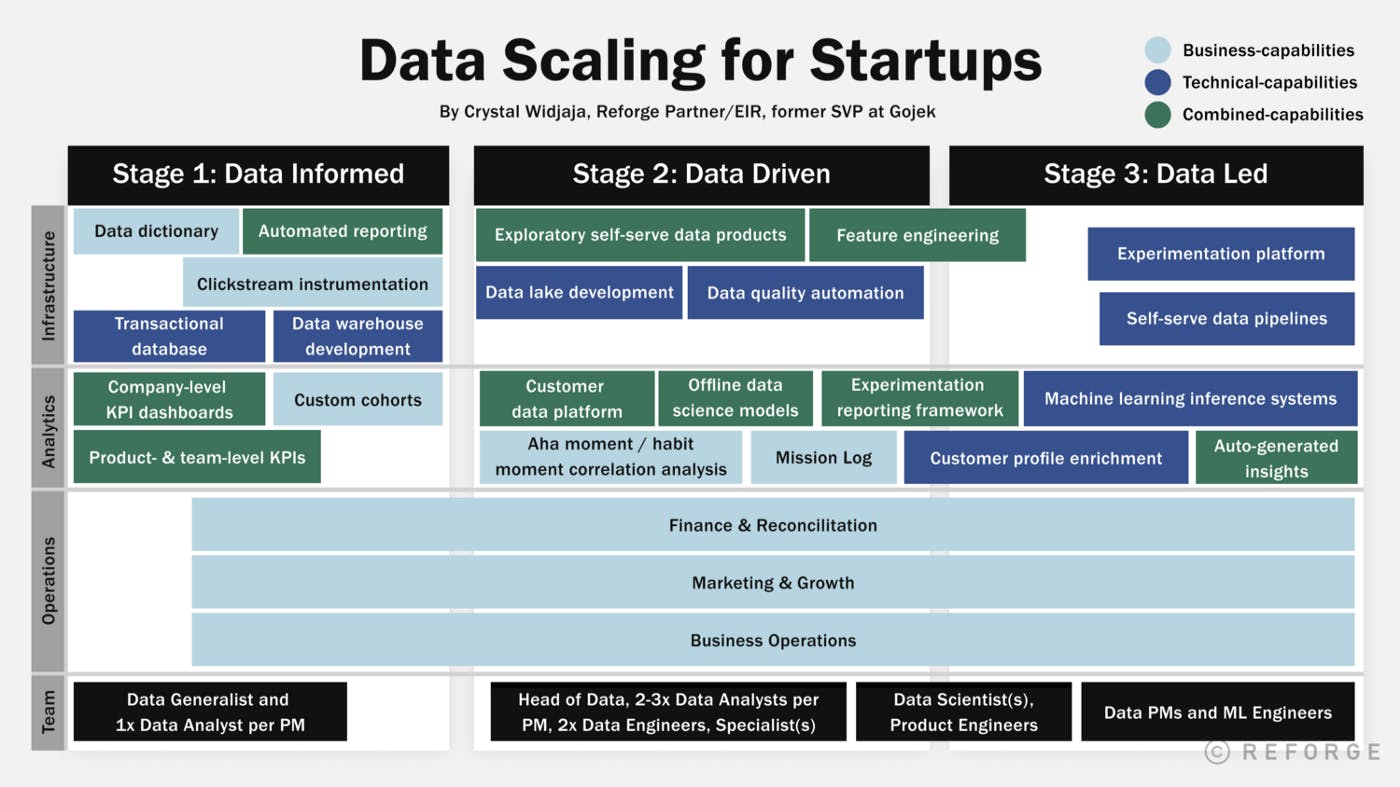
Below is a visualization of the three stages of scaling data for startups and scaleups by Reforge. As visualized, startups and scaleups should start focusing on data quality automation at the latest when they start adding data engineers to their team at stage two, i.e. when they are transitioning from being data informed to being data-driven.
So when looking at the statistics there’s, quite rightfully so, a lot of buzz around data quality in the context of modern cloud data infrastructure. However, the data quality category is still in its early innings, even though one might think otherwise when looking at the enormous investor interest in the space (driven by very concrete customer demand).
Data quality in the context of the modern data stack is still in its early innings — the difference between data observability and data quality
The immaturity of the data quality space is visible e.g. via various inconsistent terminologies used to describe core concepts in it. Words such as data quality, data validation and data observability are sometimes used as synonyms even though they are used to describe fundamentally different things. Also, the same words are oftentimes ascribed fundamentally different meanings by different people.
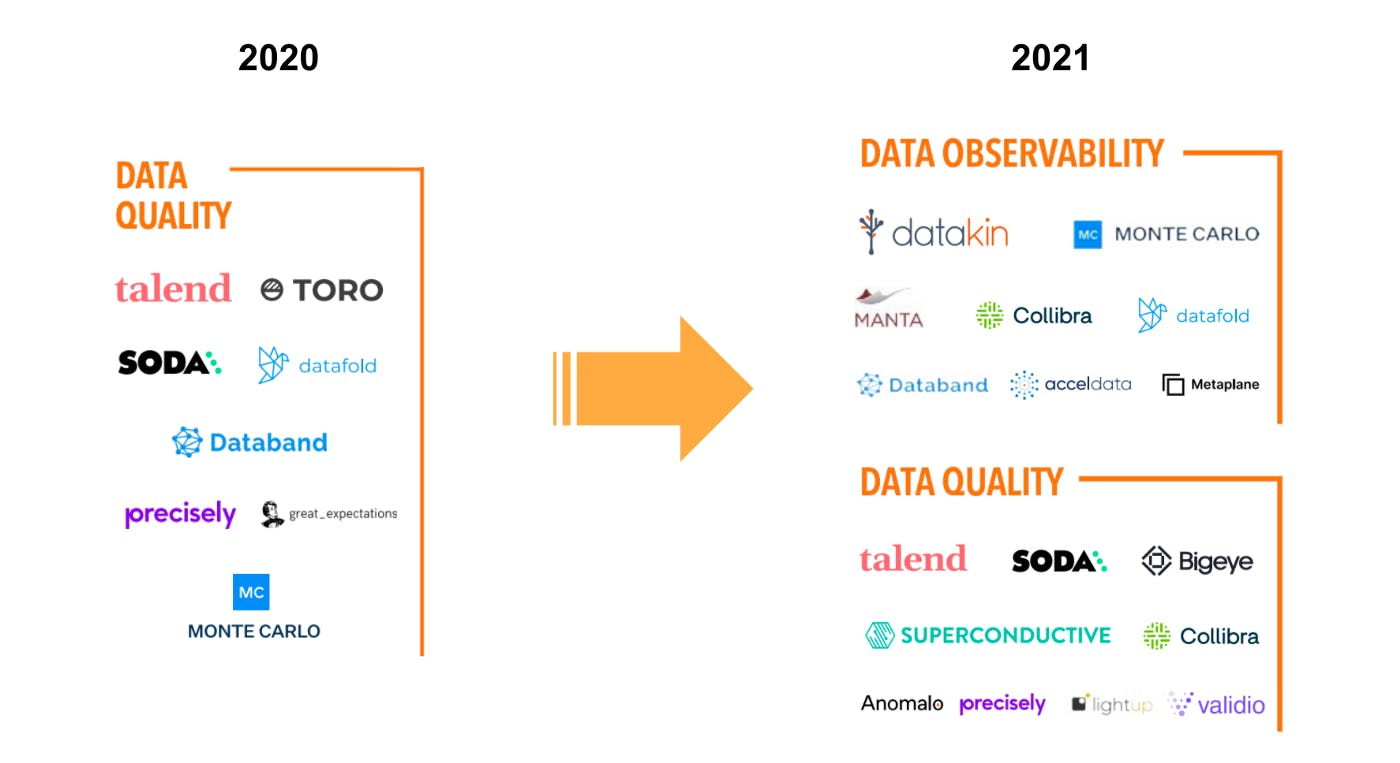
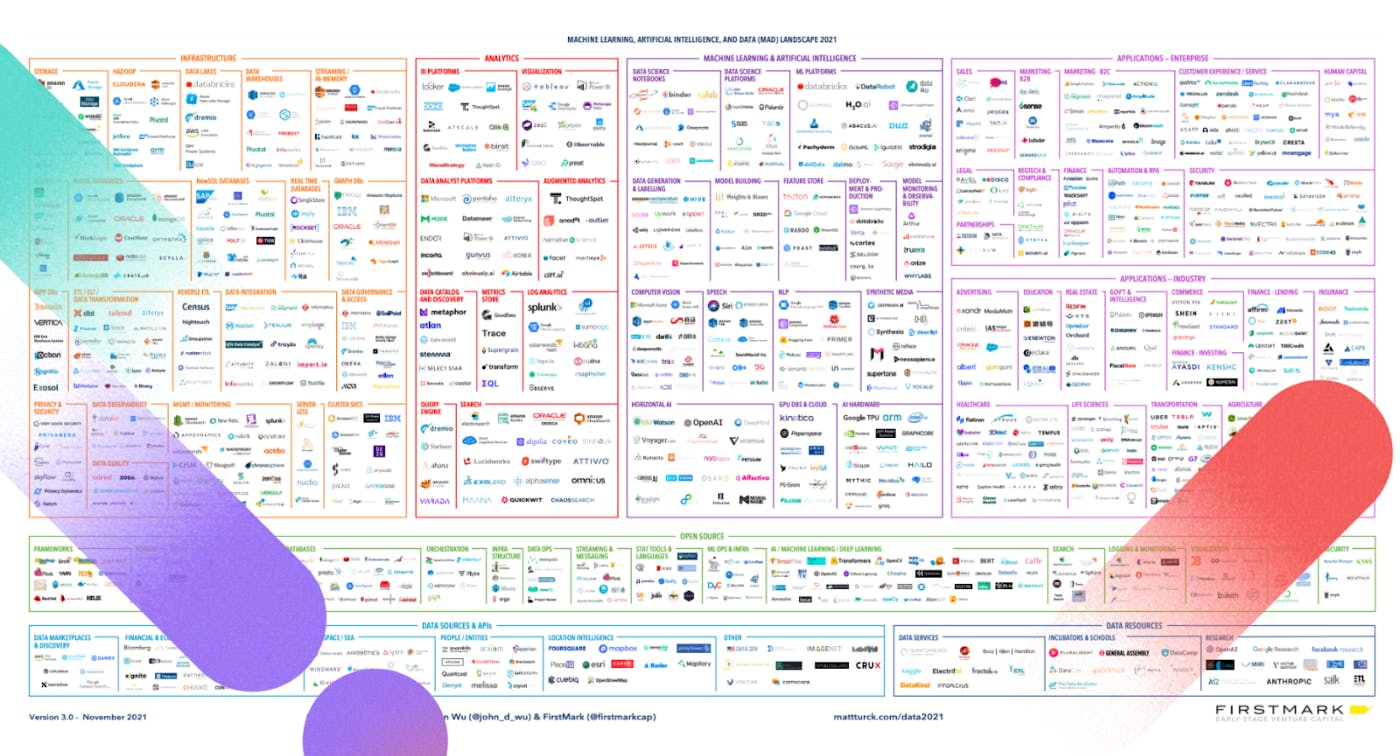
When taking a look at the data quality category in the MAD Landscape from 2021, one quickly notices that the category “Data Quality” from the mapping in 2020 is now split into “Data Observability” and “Data Quality” (see the image above). Roughly half of the “Data Quality” companies from the mapping in 2020 remain in the “Data Quality” category in 2021 whereas the other half has moved into the new category of “Data Observability”.
We at Validio agree that when looking at the current state of affairs, data quality and data observability are indeed two separate things (which most likely will converge in the not too distant future — you can read more about our thoughts about this if you scroll down).
Data observability companies offer data lineage as their core component. For example, Datakin (real-time data lineage) and Manta (automated data lineage solution) are pure play data lineage companies. On top of that, some data observability companies add on monitoring of metadata of the data pipelines (but they don’t monitor the actual data within the pipeline) such freshness(i.e. when data was lastly ingested), schema of tables that data is stored in, data completeness (row count) and null value distribution of different columns in data tables.
Data quality companies on the other hand offer solutions to monitor the actual data within the data pipelines (and some such as Validio also monitor the metadata of the data pipelines).
The different approaches within the data quality category
Within the data quality category as defined in the MAD landscape 2021, we see four major differences among the solutions provided by the companies:
1.) Rules vs machine learning and statistical tests
The approaches to monitor the data could be purely rule-based (such as Great Expectations and dbt tests) or leverage statistical tests and machine learning algorithms for dynamic thresholds to identify data failures while still allowing for user-defined rules (such as Validio).
With the recent explosion of the number of data sources that companies with modern data infrastructure are relying on, as well as the large amount of data features that each source contains, it’s becoming increasingly difficult to rely on rules if the ambition is to have comprehensive monitoring of data. It’s not uncommon for modern companies to have more than 50 data tables (including transformed tables — which are very important to monitor as well since it’s important to ensure that one’s data transformation jobs are consistent over time). If each of these tables have 20 features, you’d end up with at least 1,000 rules to be defined if it’s assumed that each feature should be monitored based on one metric only.
In reality, modern data teams most likely want to monitor each feature based on several metrics, meaning that the number of rules they need to define are several thousands if not tens of thousands. To manually set all of them — let alone update them as the nature of the data changes — is a herculean task. Therefore, we at Validio are convinced that data quality solutions for modern data teams need to offer automated monitoring based on statistical tests and machine learning algorithms to create dynamic thresholds for the metrics, while allowing data professionals to leverage their domain knowledge about the data by inserting rules where they see fit.
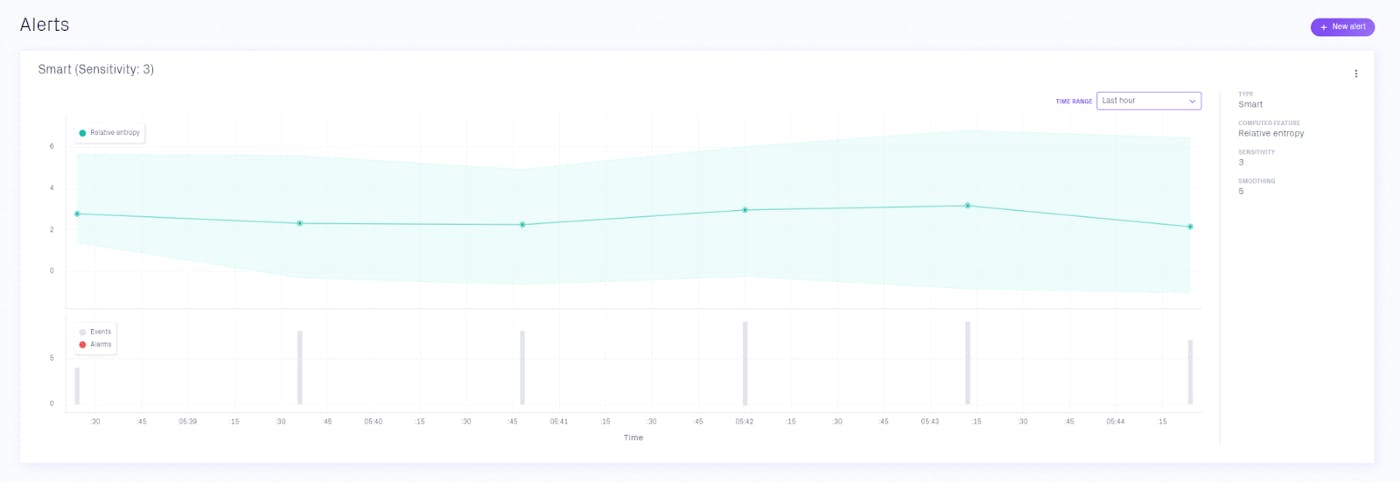
Another benefit with leveraging statistical tests and machine learning algorithms is that it allows for the usage of metrics that might be difficult for the users to fully understand, making it difficult for them to set a rule. A concrete example is a measure that Validio uses for measuring the degree of distribution shift of datasets (both numerical and categorical) over time — a metric that we have developed ourselves (which is originally inspired by the KL-divergence between two datasets).
The reason for developing this metric is that we early on realized that real-world data rarely fulfill the assumptions that many commonly known parametric statistical tests make (such as normal distribution, etc.) and therefore, we had to resort to our proprietary solution that works in “all” cases. One problem with such metrics is of course that it’s difficult for the users to understand what a reasonable threshold is, since they don’t necessarily know how it’s being calculated. Instead, by leveraging statistical tests and machine learning algorithms, the system will alert the user when the value of the metric shifts significantly compared to what is expected based on historical patterns.
2.) Data at rest vs data in motion
The vast majority of the companies in the data quality category have built their platforms and tools to monitor data at rest. This means that their data quality solutions perform SQL queries on columns (features) in relational databases and data warehouses to retrieve information such as the max, mean, median, minimum and standard deviation. The result of the query is then compared with a user-defined rule or analyzed by an algorithm to determine if an alert should be sent to the user or not.
As far as we are aware, Validio is the only company that provides a platform supporting data in motion in real-time (in addition to supporting data at rest), meaning that data from sources such as Kafka, Pubsub and Kinesis can be validated before they are ingested into data tables and further consumed. This allows real-time data quality monitoring to be end-to-end in a data pipeline.
Even though batch data use cases are still dominating the market, data quality is a real-time issue in the sense that bad data propagates in the data pipeline and therefore must be stopped as early as possible. A single bad data point that is not caught early is likely to end up in many data tables downstream through the execution of automated and scheduled data jobs. A system that is able to handle real-time data is also able to validate data in real-time, meaning that the bad data points can either be filtered out from the data pipeline or fixed (for example by reformatting a wrongly formatted datapoint or imputation of a missing value) without adding noticeable latency to the data pipeline.
Of course, creating systems for real-time data validation is difficult due to the required performance level. It’s for that reason we have chosen performant languages such as Rust (and Go), even though it’s a bit more difficult to find talented engineers with rich experience of those.
3.) Temporary persistence of data in the data quality platform
Data quality solutions that only support data at rest don’t need to persist any of the actual data inside their systems. Instead, they rely on SQL queries and only need to store and monitor the results of the queries. While this is a very non-intrusive approach, it comes with a number of limitations that according to us outweigh the benefits:
Firstly, it’s per definition impossible to monitor and validate real-time data streams without persisting the data temporarily, since this needs to take place before the data lands in a relational database or a data warehouse (from which one can apply SQL queries). For the same reason, it also makes it impossible to provide real-time auto-resolutions for data failures, such as the filtering of bad data or imputation of missing values, etc.
Secondly, it’s difficult to analyze data in multivariate dimensions through SQL queries, making those solutions often bound to simpler univariate analysis. On the other hand, if the data is persisted temporarily in the system, a modern data team can perform richer multivariate analyses to find data quality issues. A lot of data quality issues are multivariate in nature.
Thirdly, it’s difficult to provide rich partitioned analyses through SQL queries. The relevance of partitioned analyses can be exemplified in the following: a dataset column/feature with the name “Price” is likely containing information with different units. The price could be in different currencies and be for different product/service types and customer segments, etc. Ideally, a data quality platform would first partition the data into subgroups depending on important features that are expected to significantly affect the value of the price (such as currency, product/service type and customer segment) and thereafter analyse the data within each of those for data quality issues.
To analyze the data without partitioning would be a crude and rough approach — not enabling modern data teams to identify data failures unless they are very extreme (just think about it — a currency difference could introduce variation with a factor of more than 10 — and data quality issues that are identified among that kind of variation must then be greater than that…). When analyzing the data in the different partitions on the other hand, data failures are much easier to discern due to the removal of the unwanted variation (noise if you want), and once they have been identified, a big part of the root cause analysis is already done. If you know that the bad data stems from a partition of data containing prices in Euro for a particular product type, you probably know where to start looking for the source of the issue.

For the above reasons, Validio has taken the approach to temporarily persist data in its system (which is deployed in the customers cloud/VPC so no data ever leaves their own cloud environment).
This allows the Validio platform to monitor real-time data streams and provide real-time auto-resolutions to bad data, apply rich multivariate data quality analyses and partition the data before analyzing. Note that a temporary persistence of the data does not mean that the data is duplicated. In other words, Validio only keeps enough data to carry out the analyses and discards the rest as soon as it’s no longer necessary.
4.) Monitoring of actual data vs monitoring of metadata of data pipelines
Most data quality solutions only monitor the actual data and most data observability solutions only monitor the metadata of the data pipelines (if they do something in addition to data lineage). Based on +100 conversations with modern data teams, it’s clear to us that both types of monitoring is crucial — the user should not have to choose between knowing if data arrives as it should (i.e. the monitoring of the metadata of the data pipelines) and that the contents of the data is as expected (i.e. the monitoring of the actual data).
Data quality and data lineage — can they really be separated?
Even though the MAD landscape has currently decided to split up the data quality category into data observability and data quality, we firmly believe that these categories cannot be separated in the long run.
As Ananth Packkildurai (author & founder of Data Engineering Weekly and Principal Data Engineer at Zendesk) recently noted in his 2021 year in review:
“The data lineage, quality, and discovery tools will merge into a unified data management platform.”
We agree to a large extent with this notion. We believe that the future of the data quality and data observability categories will most likely converge. The difference between the two categories are temporary and the reason for a company being either in the data observability or data quality category has to do with the bet that they have made in terms of the optimal starting point.
Should one first figure out how to be the best at identifying data quality issues in modern data stacks and then couple these issues together for an organisation as a whole through data lineage functionality? Or alternatively should one start off by relating different data resources to each other and then provide relevant information about those (such as data quality) on top?
We are confident that data quality is the best possible starting point. Why? While both data quality and data lineage solutions are difficult to build, data quality is the more challenging one (especially if the intent is to provide real-time capabilities and auto-resolutions with support for multivariate analyses and data partitioning before analysing). Once the two to three fundamental features within data quality that data engineers cannot live without have been built, the next natural step is to spread this to the rest of the organization through data lineage solutions where other teams are invited to take part of the data quality insights.
To cite Laura Pruitt, Director of Streaming Data Science & Engineering at Netflix:
“Data quality and anomaly detection should be some of the first things we think about when we design data pipelines and consume data. Not an afterthought.”
Laura said the above over four years ago in 2017. We can finally see modern data teams catching up with this reality and embracing it — from early-stage startups to billion-dollar market leaders. Not only the Netflix’s, Uber’s and Airbnb’s of the world.
2022: Focus areas ahead within data quality
As already stated, the data quality category is still in its early innings and there is a lot more for the category to prove before it lives up to the hype and funding that the space has rightfully received. We are of course biased and believe that the category will explode even more once the two following challenges have been fully solved by more of the companies within the space:
Finding the two to three features that data engineers cannot live without
Despite most of the companies in the space having a handful or more customers, which to many are a sign of some kind of early product-market fit, it’s as if the category of data quality solutions itself does not yet have a product-market fit. Most of the companies within the category have approaches that differentiate themselves from the others in the same category in one or a few fundamental ways. It’s safe to say that few have managed to figure out two or three features that data engineers cannot live without. After having worked with the Validio platform in production together with leading data-driven scale-ups and speaking to +100 modern data teams, our conviction is that we’ve built at least three features that are must-haves for data engineers in a modern data quality platform:
- Multivariate analysis: on top of analysing just one feature/column at a time, the Validio platform supports multivariate analyses for identifying data failures
- Data partitioning: the Validio platform can partition, based on different categorical features in the dataset, a dataset into many different sub-datasets to be analysed. This allows for much more granular and meaningful data quality monitoring and validation.
- Real-time auto resolutions: the Validio platform has the ability to perform schema-consistent operations on the data in real-time to e.g. impute missing values, reformatting erroneously formatted data, filter out anomalies, etc. The fixed data is also written out of the system in real-time (for example through a stream or into a table).
Features such as dynamic thresholding based on statistical tests and machine learning algorithms as well as the optionality to monitor both the actual data and the metadata of the data pipeline will most likely become hygiene features of data quality solutions rather than a source for differentiation.
Different companies might find different features that are must-haves for data engineers, and they might not all fit into one single product (at least not in the near term). In other words, we are likely to see several winners in the category.
Integration with the modern data stack — the need to go beyond Slack alerts
For a data quality solution to be successful, it’s paramount that it can integrate with and play nicely with different parts and tools of the modern data stack. This goes beyond integrating with common data sources in the modern data stack such as Snowflake, Bigquery, Redshift, Kafka, Pubsub, Kinesis, etc. For example, it’s not too helpful for a data team to only get notifications through Slack, email or any other communication channel each time a bad data point or a dataset-level issue has been identified. Instead, this is information that data engineers would want to consume as a part of their data orchestration flow (through for example tools such as Airflow, Argo, Dagster, Prefect, Luigi etc.). If the data from a certain data source is of too poor quality on a dataset level, you might want to stop the data jobs entirely and not consume that data further. However, if the dataset is of acceptable quality, you want to be able to get hold of every bad data point that has been identified (with their respective error messages detailing why the data is bad) and properly take care of them based on their respective issues (e.g. to filter them out of the data pipeline entirely, to replace their values with newly imputed values, etc.).
People from the operations who rely on the data want to receive the partition of the good and bad data that they are concerned with displayed directly in their dashboards through for example Tableau or Looker instead of having to consume information about all of the good and bad data, since they are most likely only concerned with a subpart of that.
Furthermore, to facilitate the adoption by especially larger companies, data quality solutions need to go beyond a nice and intuitive GUI (which in itself is a must-have but not sufficient) and provide support for Infrastructure as Code (IaC). Among other things, it allows the user to version control the configuration of one’s data quality monitoring and automates and increases the speed of setting things up and making changes in the configuration.
During the past few months, we’ve spent considerable resources to make these integrations, allowing for Validio to integrate into the existing workflows of modern data teams, thereby solidifying the platform as a natural component in a modern data stack. But of course, there’s more work to be done.
Data is eating the world — making modern data quality technologies a core piece of the modern data stack
Marc Andreessen famously said a decade ago that software is eating the world. Now data is eating software and the rest of the world.
The modern cloud data stack is undergoing massive construction and the future of software will be defined by the accessibility, use and quality of data. And the startups creating the picks & shovels (e.g. modern data infrastructure tools) are the ones growing explosively.
During the past years, the floodgates have truly opened and every company, big or small, can now store and process massive amounts of data and use it to drive value across their business and unlock new opportunities. In summary: data pipelines that move data from one place to another have truly become the nervous system of the modern data-driven company. Subsequently, every modern data team will have to deploy some kind of automated data quality validation and monitoring technology. Otherwise, they won’t be able to trust the sourced data.
We’re really excited about 2022 and look forward to reading about the developments both in the broader modern data infrastructure space and more specifically the data quality space in the MAD Landscape 2022.
We’ve barely scratched the surface here.
