The puzzle of irregular seasonality
When defining anomaly detection algorithms, incorporating seasonality patterns is essential to ensure that the monitored data represents the underlying reality of the business operations. But seasonality patterns are often irregular, making it challenging to detect deviations accurately. Undetected anomalies, a villain we call silent data issues, can hurt your business without you knowing.
On the other hand, alert fatigue can quickly develop if your anomaly detection model picks up on too many signals. We’ll revisit how Validio mitigates alert fatigue later in this post.
To accurately detect anomalies in irregular data patterns, there are generally two types of seasonality patterns you have to consider: calendric or fuzzy.
Let’s walk through each of these and their potential business impact.
Calendric seasonality
Calendric seasonality corresponds to regular fluctuations in data values within specific time periods and are often tied to business cycles. For instance, businesses plan their work on a monthly basis, set quarterly goals, and review costs annually during budget planning. It is natural for these patterns to be reflected in your data.
To illustrate this, let's consider an example.
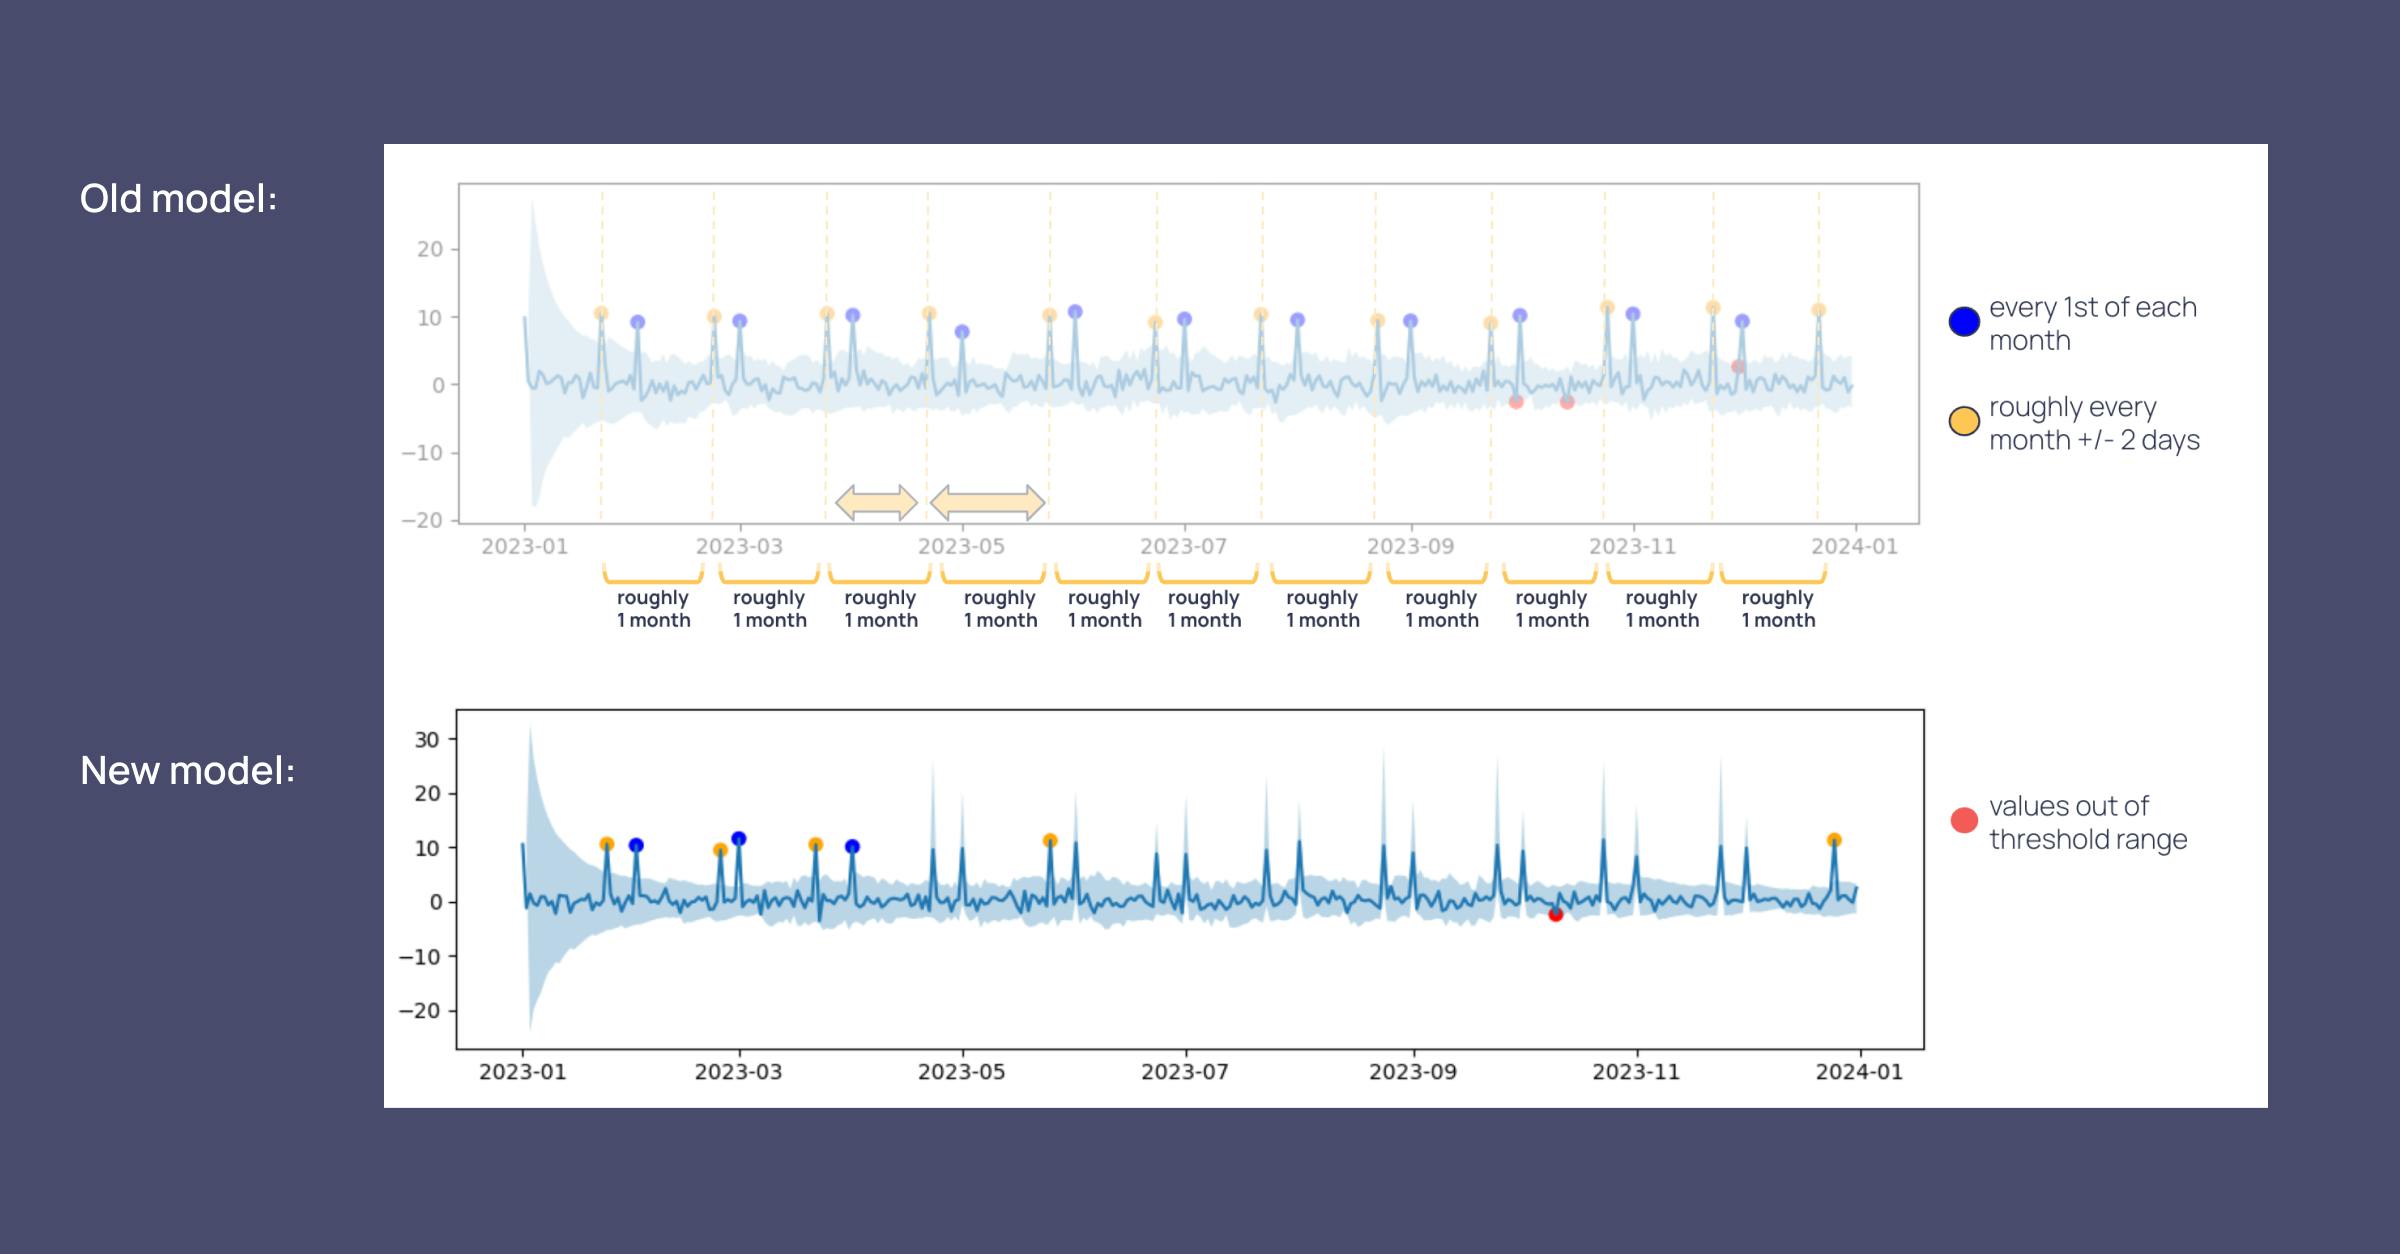
Suppose you have an Airflow job that runs on either the first or last day of the month to collect data from third-party vendors. This data is used to calculate important performance metrics for your business. This doesn't mean that you are not interested in tracking your KPIs daily or weekly. It's simply a consequence of relying on external data sources.
In Validio, you can set up volume validators to monitor the incoming row counts of your datasets. These usually returns a value of 0 on all days except when your pipeline runs to ingest data. These specific days are when you actually receive the data, but they don’t show how the underlying data changes in reality—between pipeline runs. With the improved Dynamic Thresholds, you will be able to account for these unique behaviors in your data.
By accurately detecting anomalies even in complex data patterns, you can ensure that your metrics reflect the true nature of your business operations.
Fuzzy seasonality
Fuzzy seasonality, a slightly more elusive phenomenon, also possesses the power to disrupt your operations.
Fuzzy seasonality refers to unpredictable patterns that can occur in various forms. While we may understand and explain these patterns in hindsight, it is challenging to predict when they will happen on a macro scale. However, by analyzing sufficient historical data, we can learn and account for the fact that there will be some deviation from the usual behavior in the data.
To better understand this concept, let's examine the example of paydays. In Sweden, payday typically falls on the 25th of the month, unless it falls on a weekend. In such cases, it is moved to the last weekday prior to the 25th. This consistent event can impact your metrics, but it is important to recognize that its influence may vary across different segments or regions. For instance, the impact of payday in India might differ from that in Sweden. Therefore, your monitoring approach should be flexible enough to detect and adapt to these variations in real-time.


