Heroes of Data is an initiative by the data community for the data community. We share the stories of everyday data practitioners and showcase the opportunities and challenges that arise daily. Sign up for the Heroes of Data newsletter on Substack, follow Heroes of Data on Linkedin to make sure you get the latest stories, and apply to join the community here.
If you live in a big city, you’ve surely seen e-scooters in the street. Perhaps you’ve also ridden one? In this article, we summarize Fernando Brito’s talk on how the micromobility company Voi uses geospatial data to optimize their fleet. He gives an introduction to geospatial data, how it can be represented in a database, how Voi ingests this data into Snowflake, and why they decided to split the surface of the Earth into hexagons for more advanced use cases. Sit tight!
Who is Fernando Brito?

Let’s start with an introduction to the star of the show: Fernando. He works as Staff Data Engineer at the micromobility company Voi Technology. In fact, he was the first Data Engineer there! Before joining Voi, he worked at other data-driven companies including Natural Cycles. He’s also a Snowflake Data Superhero, meaning he’s a Snowflake ambassador—very impressive indeed.
Fernando’s roots are in Brazil, and he is a true global citizen. He’s lived in multiple countries throughout his life including the Netherlands, Germany, and now in Sweden. In his free time, he likes to travel, and is—according to himself—”really into maps.” This is exemplified in his pet projects where he asked the government for data to map all bus stops in his home city, and when he built a website to log the locations of all of his travels across Europe.

What does Voi Technology do?
Voi was founded in Sweden in 2018, and is a multimodal micromobility provider operating across Europe. In total, they have served over seven million users and have close to a thousand employees. They provide e-scooters and e-bikes as part of their larger vision to create
“Cities made for living, free from noise and air pollution.”
In other words, Voi believes in a future where the city dwellers reclaim the streets of towns and cities. Their vision is a shift towards a new model of mobility that focuses more on society, sustainability, and inclusion rather than private car ownership.

What does Voi need in order to achieve this?
Well, lots of things, but one very important pillar is of course data about the locations of their fleet, including parking spots, ride duration, and much more. Collecting, managing, and using this data is not a one-team responsibility at Voi. Instead, they use a hybrid model with central teams providing a data platform and best practices, and different domains having their own data resources. This means data analysts sit together with the data producers in the product teams, and jointly they have full ownership of their data.
What is geospatial data?
If you’re like most people, you probably interact with maps on a daily basis. But if you’ve never worked with geospatial data, it can seem a bit abstract. Below is a screenshot from a map provider called OpenStreetMap, an open and collaborative project to map the world. You can think of it like Wikipedia for maps.
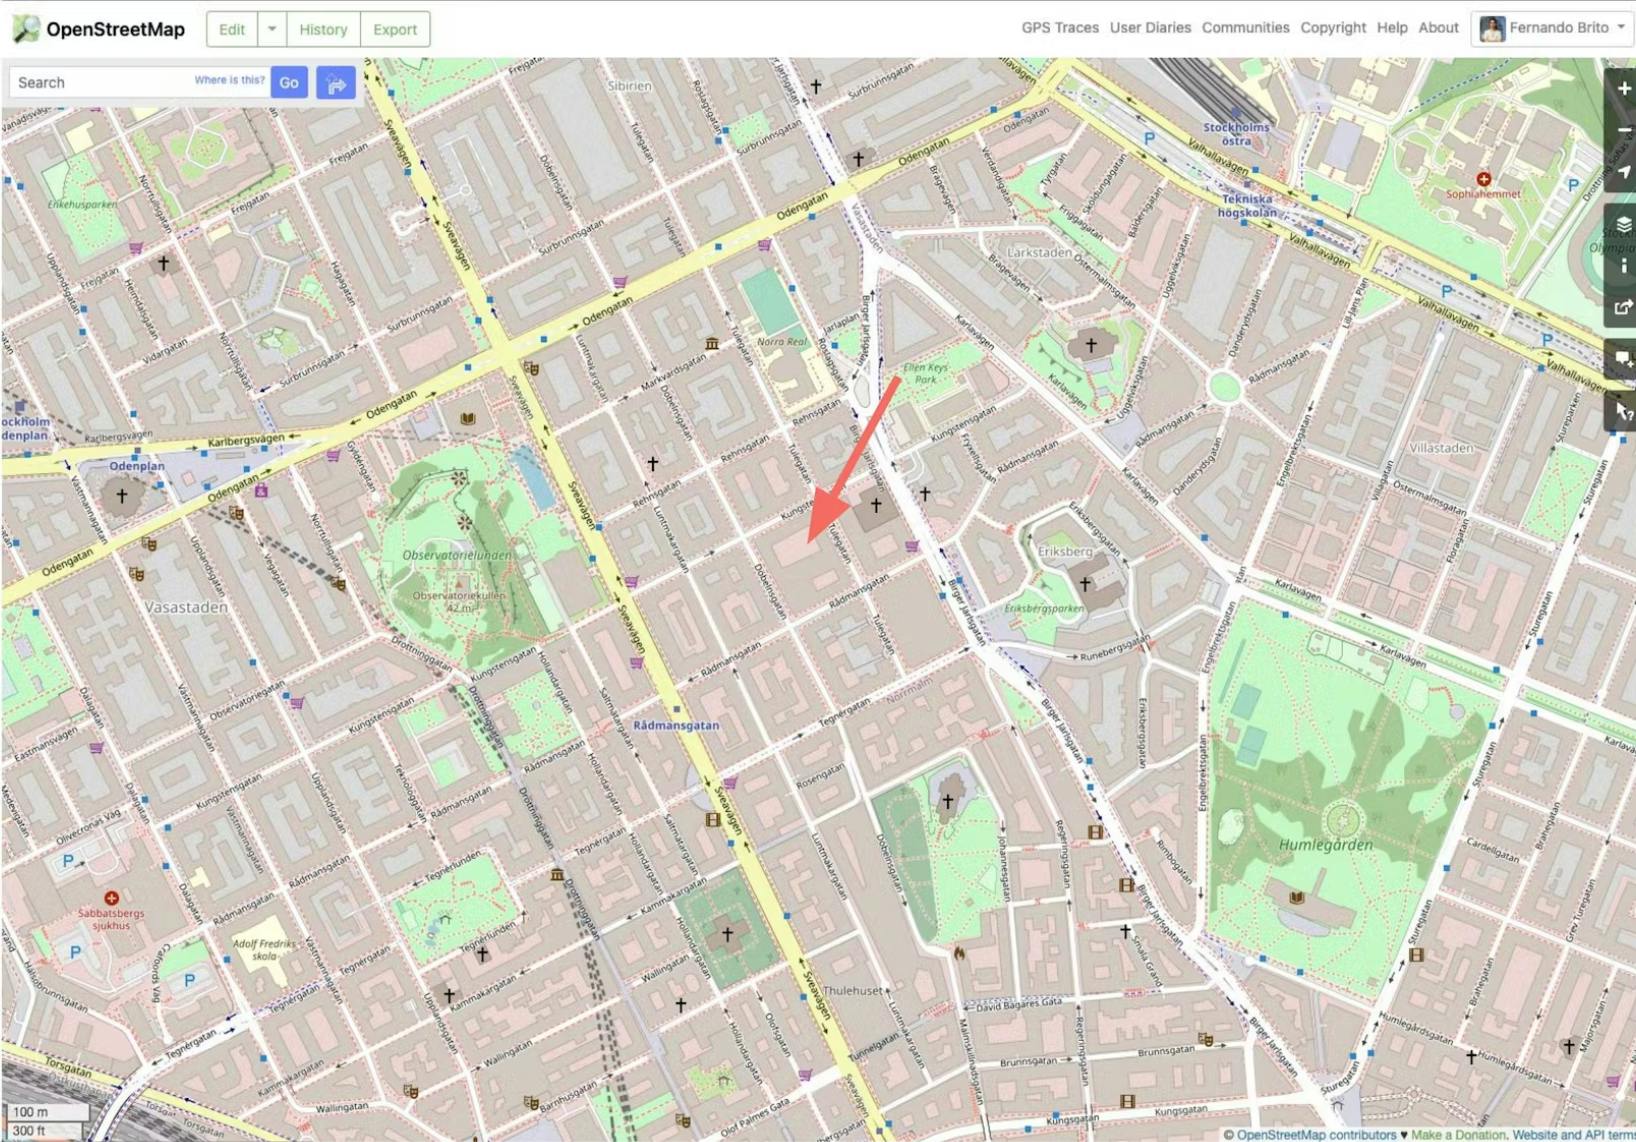
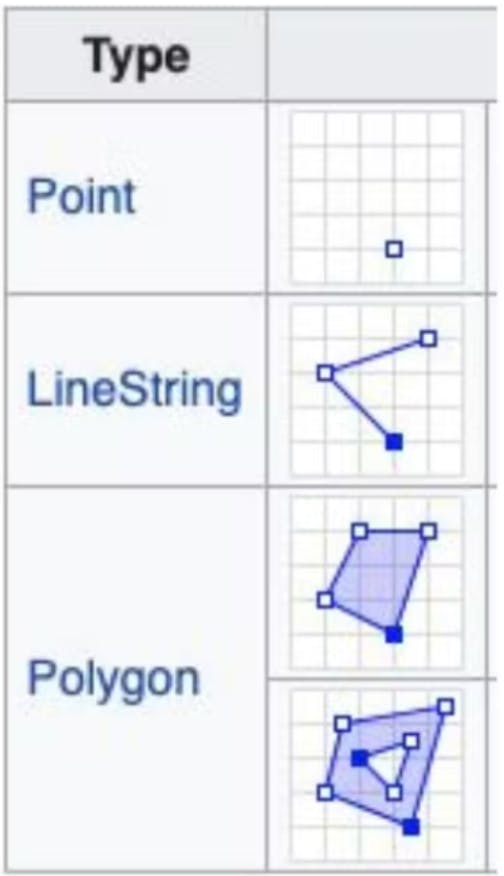
Have you ever considered how exactly such maps work, in terms of data? How and where is the data that you see on the map actually stored? It turns out that everything from this image can be represented using only 3 primitives or building blocks: a point, a line, and a polygon.
Let’s have a closer look behind the scenes of OpenStreetMap; if you look at the top of the map image below, you can see that the options to contribute to the map are to add a point, a line or an area, and metadata. This way, you can create everything that can possibly live on a map—including traffic lights, street lamps, and even trees!
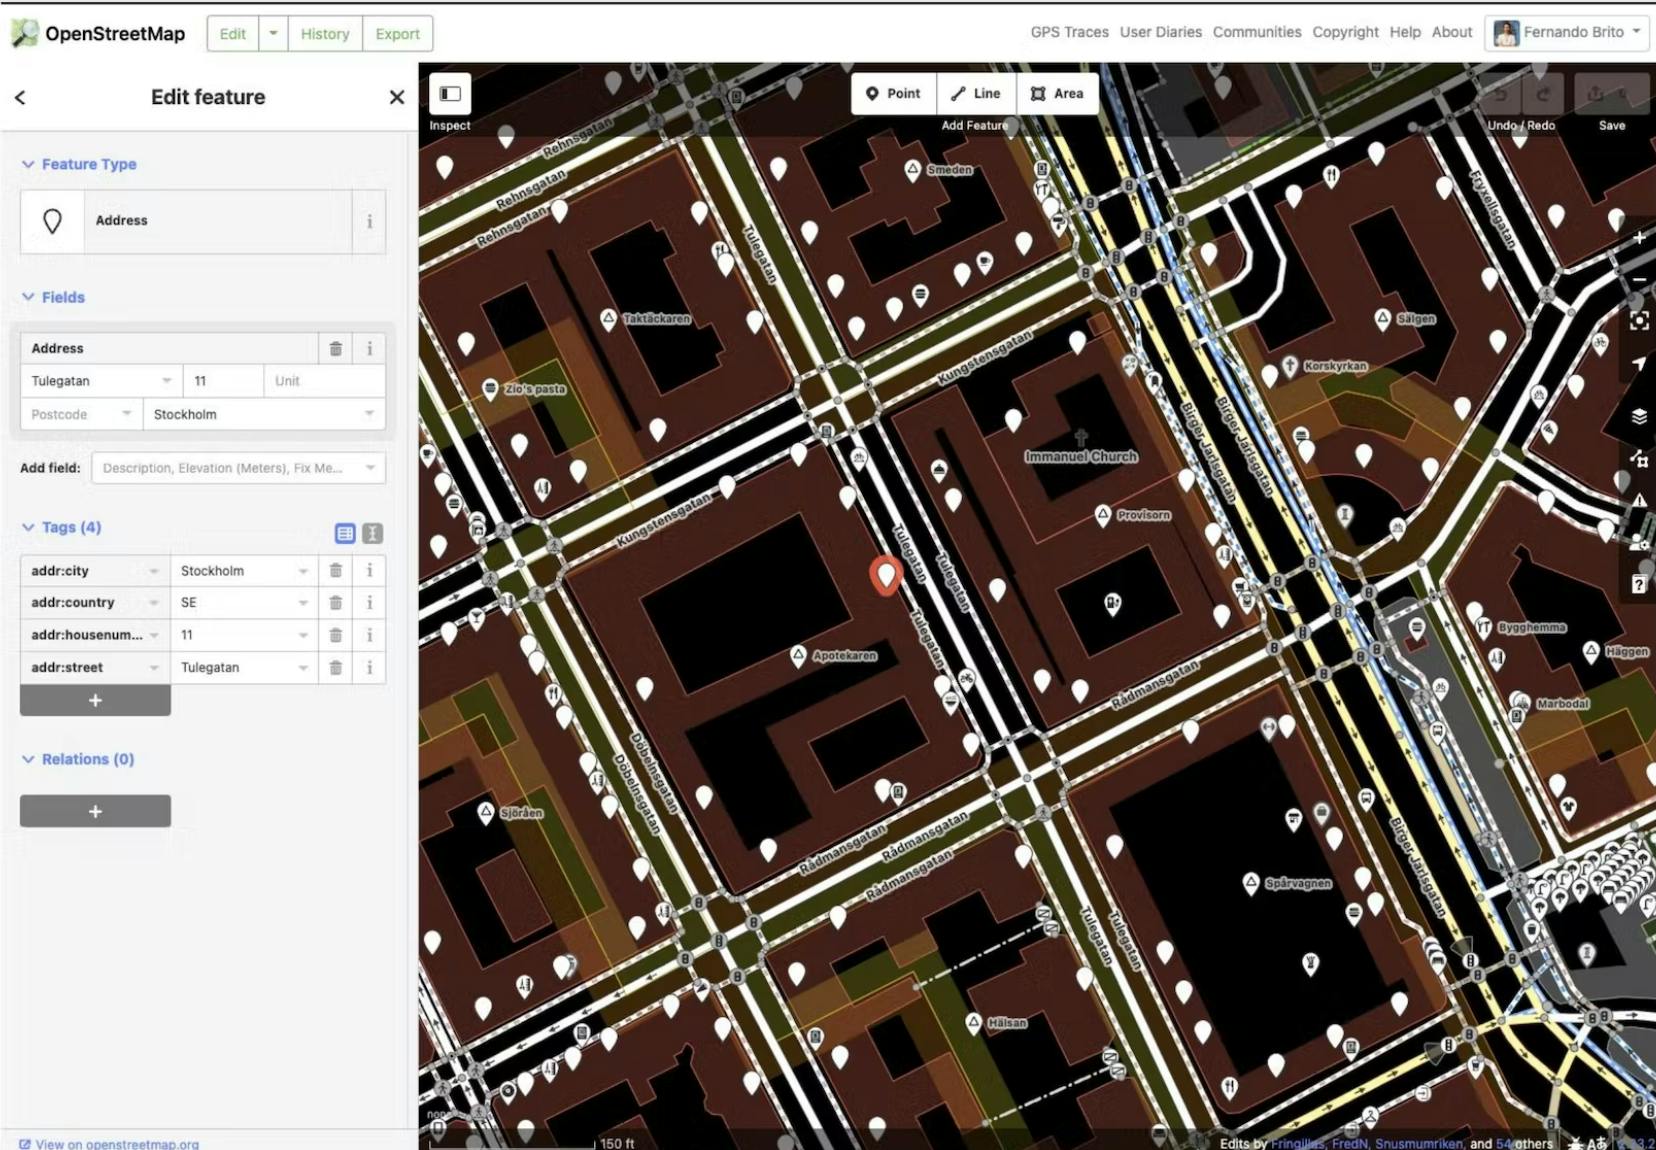
In summary, maps are all about points, lines and areas. But what does that mean in terms of databases, tables, columns and rows? Many of us are data people after all, so let’s dig a bit deeper.
There are many standards to represent those three primitives. Some of the most popular ones are called WKT, WKB, and GeoJSON. Below we can see examples of how to represent those primitives using WKT, which is a very lightweight format. A point is represented as a pair of coordinates, a line is a sequence of points, and polygons are lines that form a region.
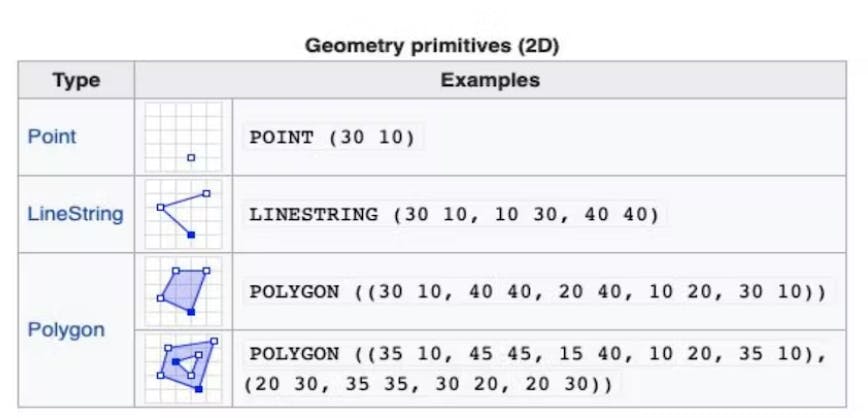
Voi uses Snowflake to implement their data warehouse, and Snowflake provides a data type called “Geography” which allows for storing such primitives. The data can be represented as strings and Snowflake will automatically detect and convert them to the appropriate type.

A benefit of using Snowflake for geospatial data is that they provide over 50 geospatial functions to operate on these types. These functions can be called like any other built-in function of a database, including in JOINs, WHERE clauses, and so on. Some of the functions will output a number, others a string or a Geography. Some examples include parsing, conversion, relationship, and transformation to answer questions like:
- Is an object within another object?
- What’s the distance between two objects?
- What’s the perimeter or area of a region?
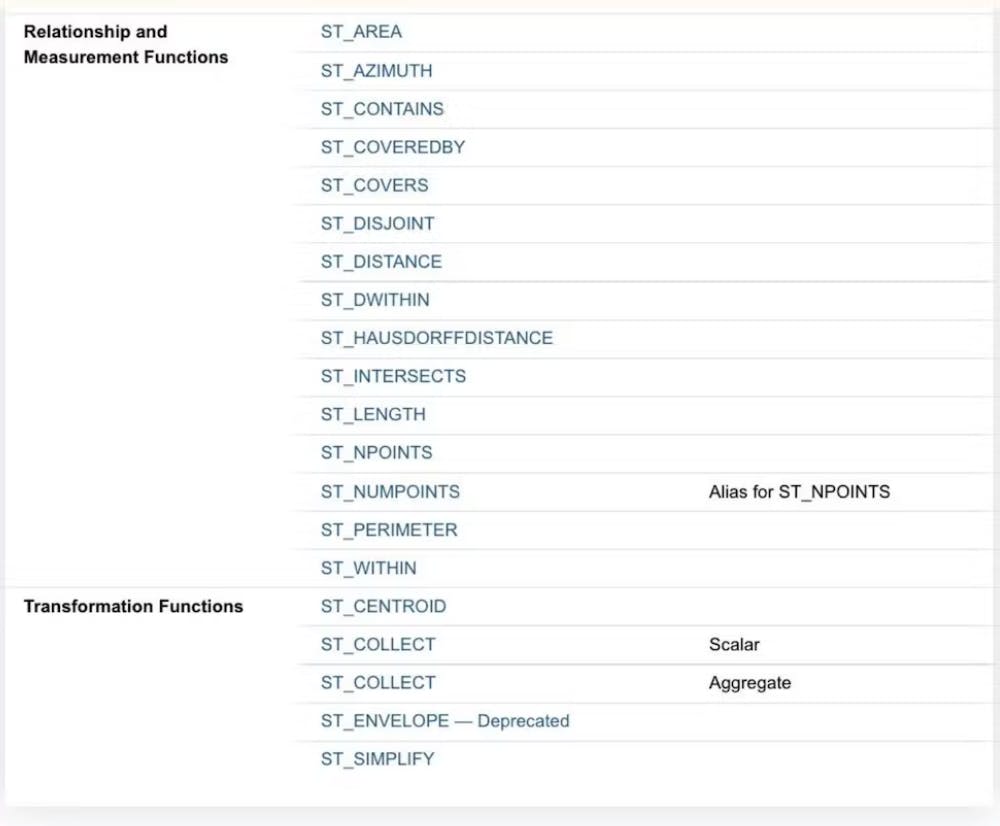
Now let's make this more practical and see what business problems can be solved at Voi using this setup.
Geospatial analytics at Voi—simple use cases
Voi operates around 100,000 vehicles across Europe. Each one of them is constantly reporting its location, battery, mechanical issues, etc, many times per minute. This means Voi ingests 350,000 rows of data per minute, or about 20 million rows per hour. In addition, some data also comes from Voi’s user-facing app and the events collected there.
The data that comes from the IoT devices installed in the vehicles go through many systems and are represented using different formats before it eventually ends up as messages in a message queue. Voi uses Google Cloud Platform as its cloud provider and relies heavily on Google Pub/Sub for its real time messages. Once available on Pub/Sub, Voi uses Google Dataflow to micro-batch those messages into files, which are then stored on buckets in Google Cloud Storage, at a frequency that can be controlled depending on the use case (e.g. a couple of minutes). Every time a new file is written to the bucket, a Google Cloud Function is triggered to ingest the raw data into Snowflake. There, it is immediately available for querying and for further complex transformations and aggregations. Overall, it takes only a few minutes from when the data is produced in the vehicles to when it’s available for querying in Snowflake.
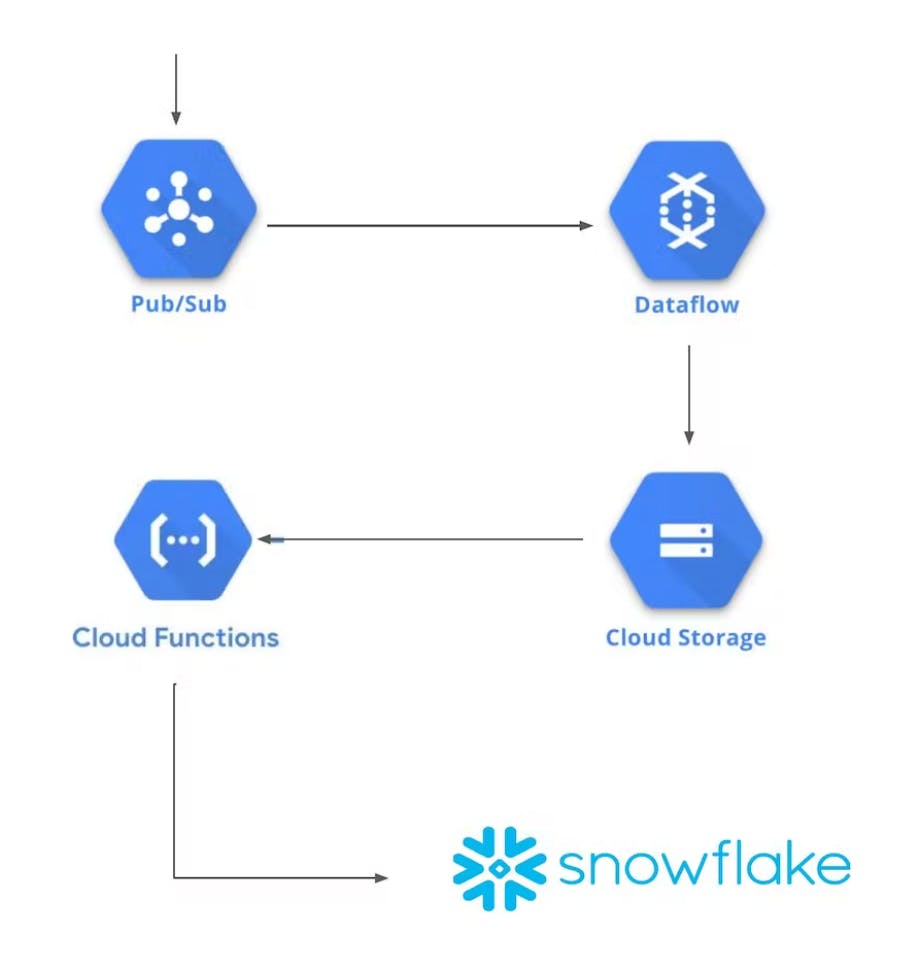
Voi then uses this data for a number of use cases, including:
- Fleet status and health, e.g. is the vehicle standing upright or lying on the ground?
- Operations compliance, e.g. were the scooters delivered to the agreed-upon parking spot by the third party operator?
- User end ride behavior, e.g. is the vehicle parked correctly, within a parking zone?
- Feature validation, e.g. does the vehicle slow down as expected in the city’s slow zones?
- Intermodality analysis, e.g. how many people use a Voi scooter to get to a bus stop?
Geospatial analytics at Voi—the grid system
Now that the basics of geospatial data are covered, and we’ve had a look at how Voi’s data is ingested into Snowflake, it’s time to take a look at some of the more advanced data use cases at Voi. For this, we’ll need a grid system.
What are grid systems?
It turns out it’s very useful to split the surface of the Earth into areas in a consistent and deterministic way. Doing this allows for many interesting analyses based on an area and how user behavior changes within that area—as opposed to per individual point, which often is a much less meaningful analysis.
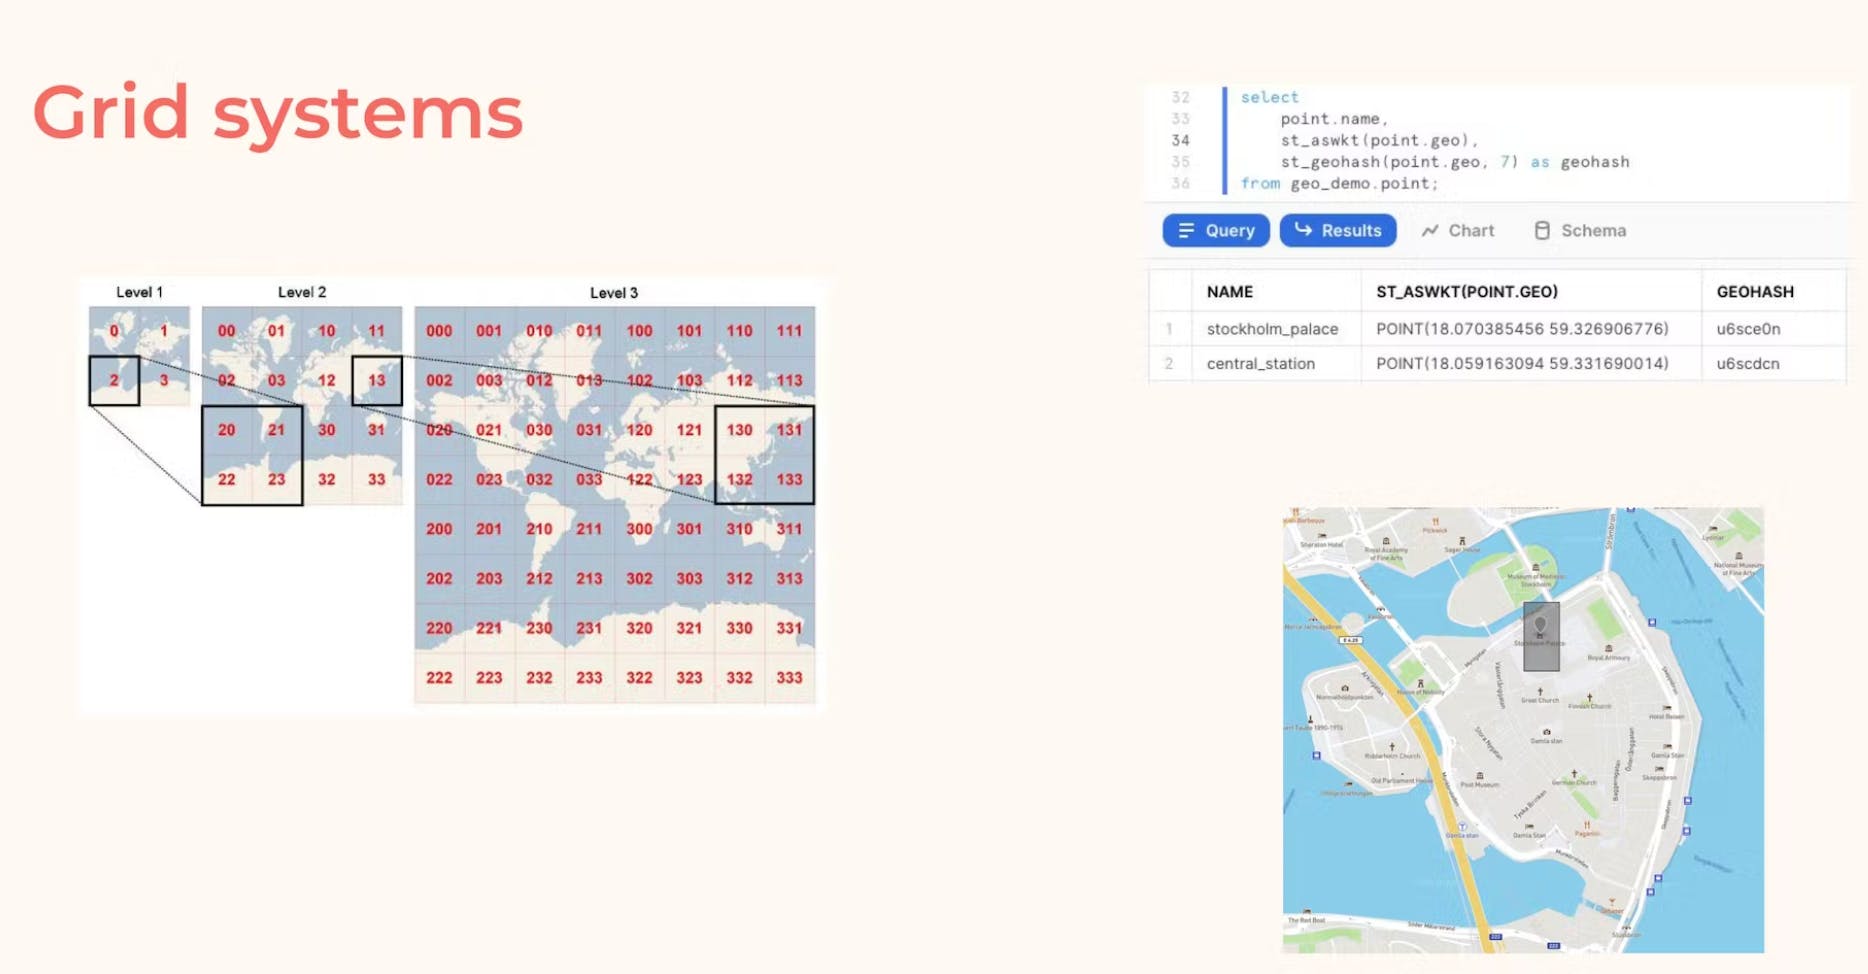
The most basic question that a grid system helps answer is: which cell does a certain point belong to? With this, we can aggregate metrics from individual points (e.g. take the average of how long it took for our users to park) and compare this value over time for a single cell or compare different cells with each other.
There are many ways to set up a grid system, because there are many shapes one could divide the surface of the Earth into. For example, it’s possible to use squares, triangles, and hexagons. What’s interesting about the particular shape is that each shape comes with its particular set of properties.
As illustrated in the image below, triangles and squares, albeit simple, come with a drawback: they are not so consistent; Sometimes one cell shares an entire side with a neighbor, and sometimes it shares only a single point. Hexagons, on the other hand, are very consistent. The center of a cell has an equal distance to the center of all neighboring cells. This allows for some very nice computations when analyzing geospatial data. Coincidentally, it’s also a shape common in nature—most famously in beehives.
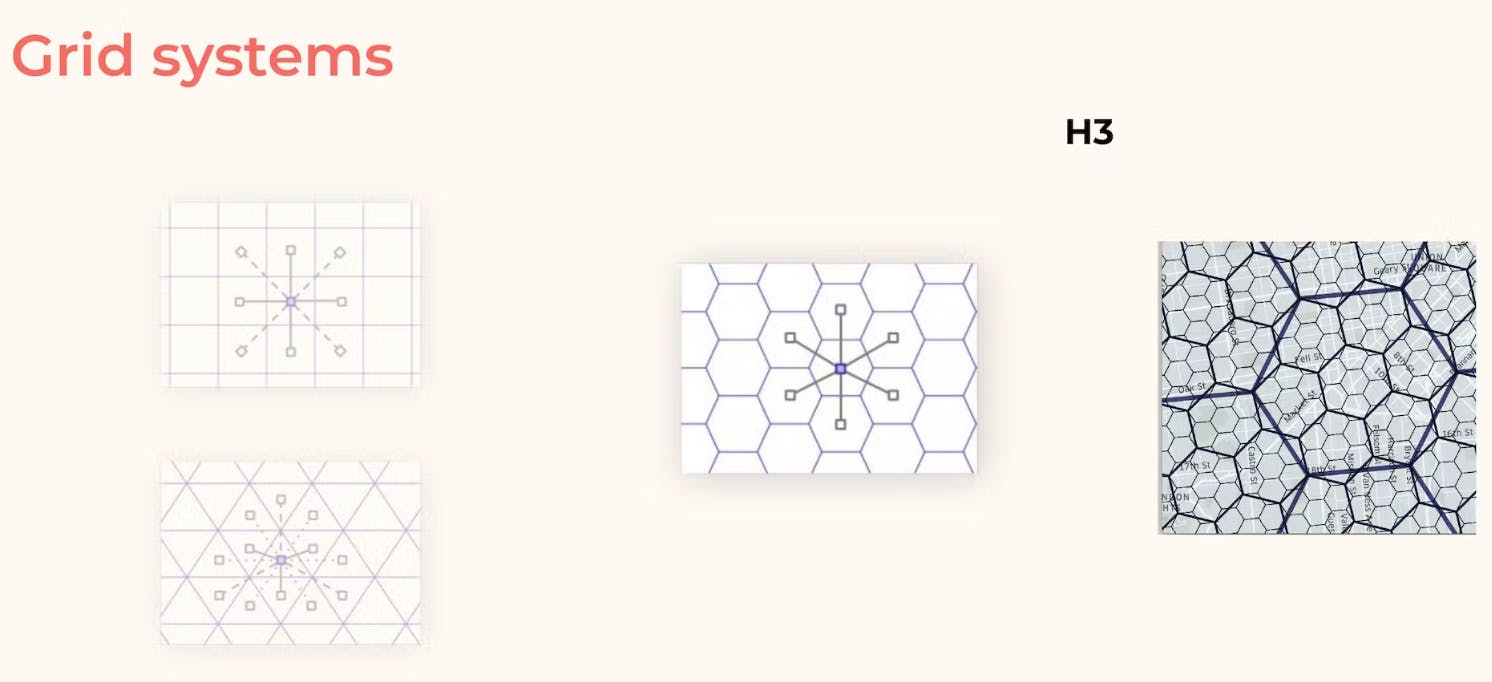
Fernando and the rest of the Voi team did some research on what other companies in similar industries are using, and found a grid system that uses hexagons, called H3 and developed by Uber. After evaluating it, they were pretty happy with the results, and it’s the system Voi uses today. However, there was a challenge: Snowflake didn’t provide H3 functions out of the box.
Implementing H3 in Snowflake
Luckily, it was possible to expand Snowflake capabilities for custom needs using “User Defined Functions” (UDFs). Fernando and his team searched Uber’s official H3 website and found implementations in a number of different languages, providing functionalities such as:
- Given a pair of coordinates and a zoom level, what is the corresponding hexagon for it?
- Given a hexagon, what are its neighbors?
- Does a point belong to a hexagon?
One of Uber’s implementations is written in Javascript, which can be optimized as one single Javascript file. After some tweaking, the Voi team was able to include those functions as UDFs in Snowflake. In practical terms, it means the team can now call functions from this Javascript library through UDFs directly in Snowflake, without the need for external data pipelines. They can be invoked either on-the-fly, when analysts are writing their queries, or pre-calculated for the most common use cases.
However, if you are looking into implementing H3 today there’s a much easier way. In fact, there’s a provider called Carto that offers this functionality through the Snowflake marketplace for free.

Using Hexbins at Voi
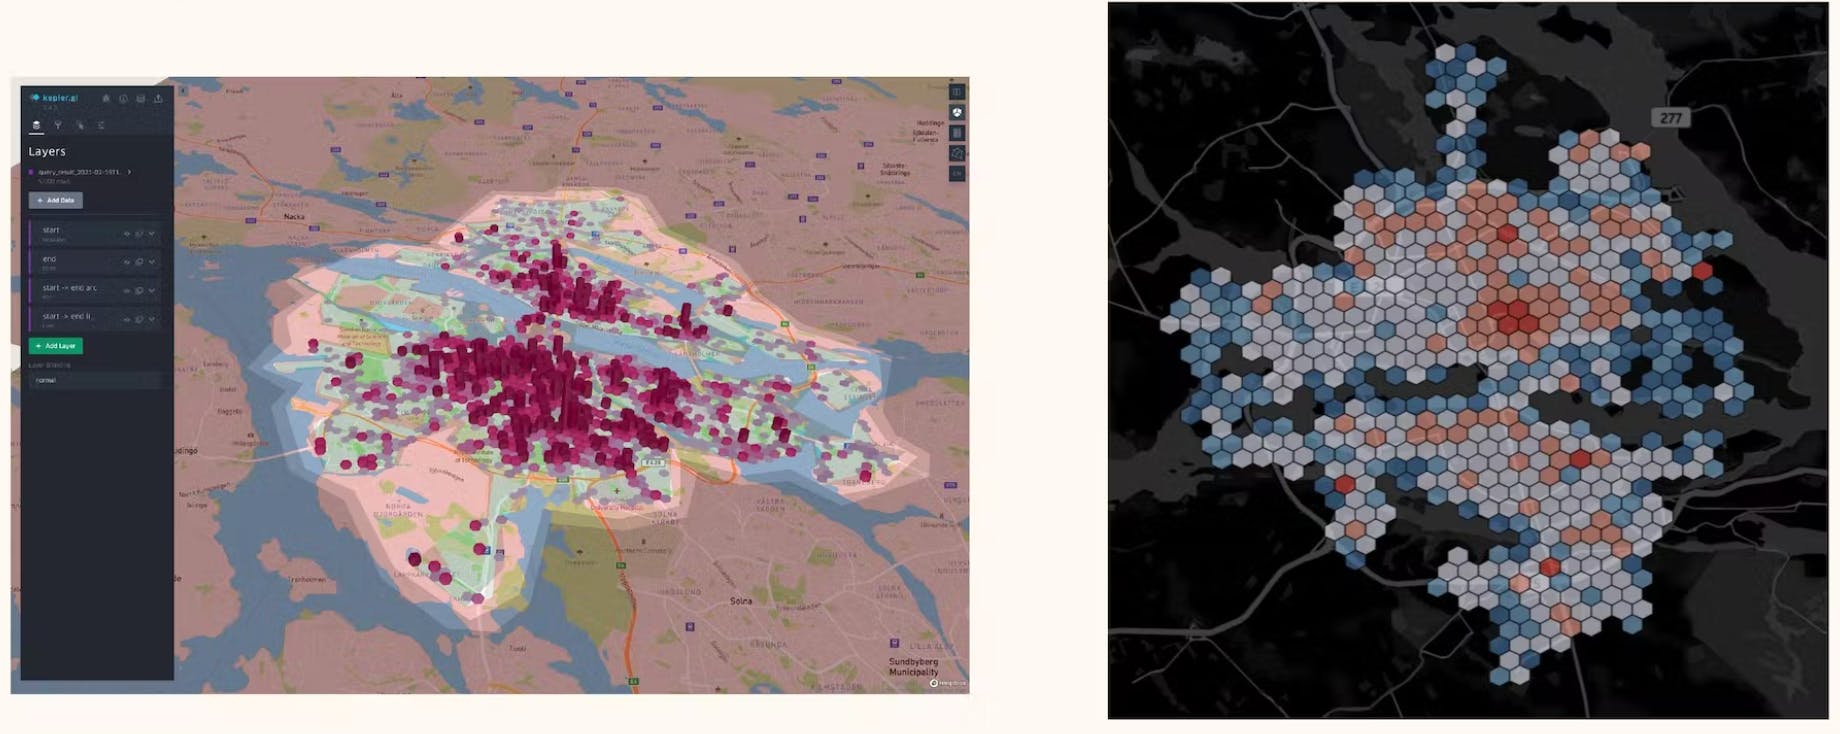
With H3 implemented and ready to go in Snowflake, the Voi team was able to conduct some much more advanced analyses. These analyses included:
- Understanding supply versus demand of vehicles in a given area
- Changes in demand over time
- Rider behavior per area
- Forecasting
- Query optimization
Let’s take a look at two of these in more detail: Query optimization and rider behavior.
Query optimization
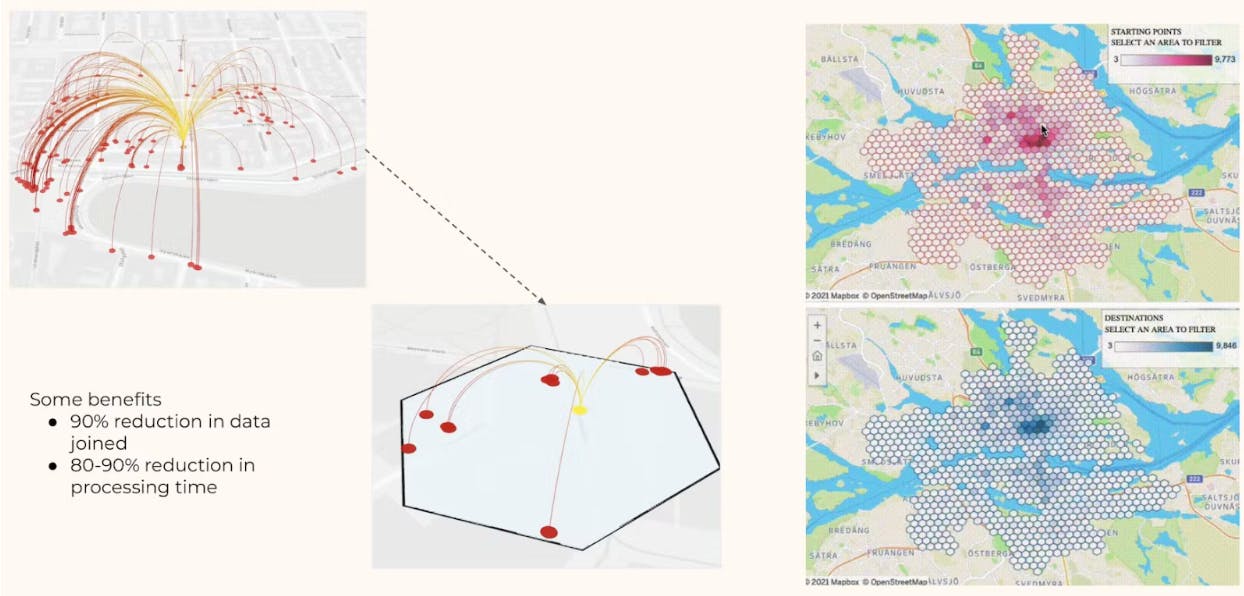
Working with a grid system allowed Voi to optimize some of their geospatial queries by around 90%. Sometimes, the team needs to find out what events happened close to a reference point. For example, the reference point might be the location where a person is trying to finish a ride, and the team needs to find the nearest parking spot to that location. Doing this type of query in a naive way would require calculating the distance of all parking spots to all the reference points, to be able to find which ones are within some desired distance.
When using hexbins on the other hand, it’s possible to quickly limit the scope of which points to include when calculating the distance. This is because the hexbins can be used to prune irrelevant data in a very efficient way. The Voi team even pre-calculates to which hexbin some of their data belongs, resulting in an even more performant system that enables live reporting of millions of data points.
Rider behavior
The next use case is rider behavior, which warrants some more business context before diving into the data setup. One of the general challenges in Voi’s industry is to make sure users respect the road and traffic regulations. For example, making sure users park in the appropriate places, and ride only in the allowed areas. In most cities, riding on the sidewalk is not allowed. Scooters, just like bikes, should use bike lanes when available, or otherwise ride on the streets together with cars.
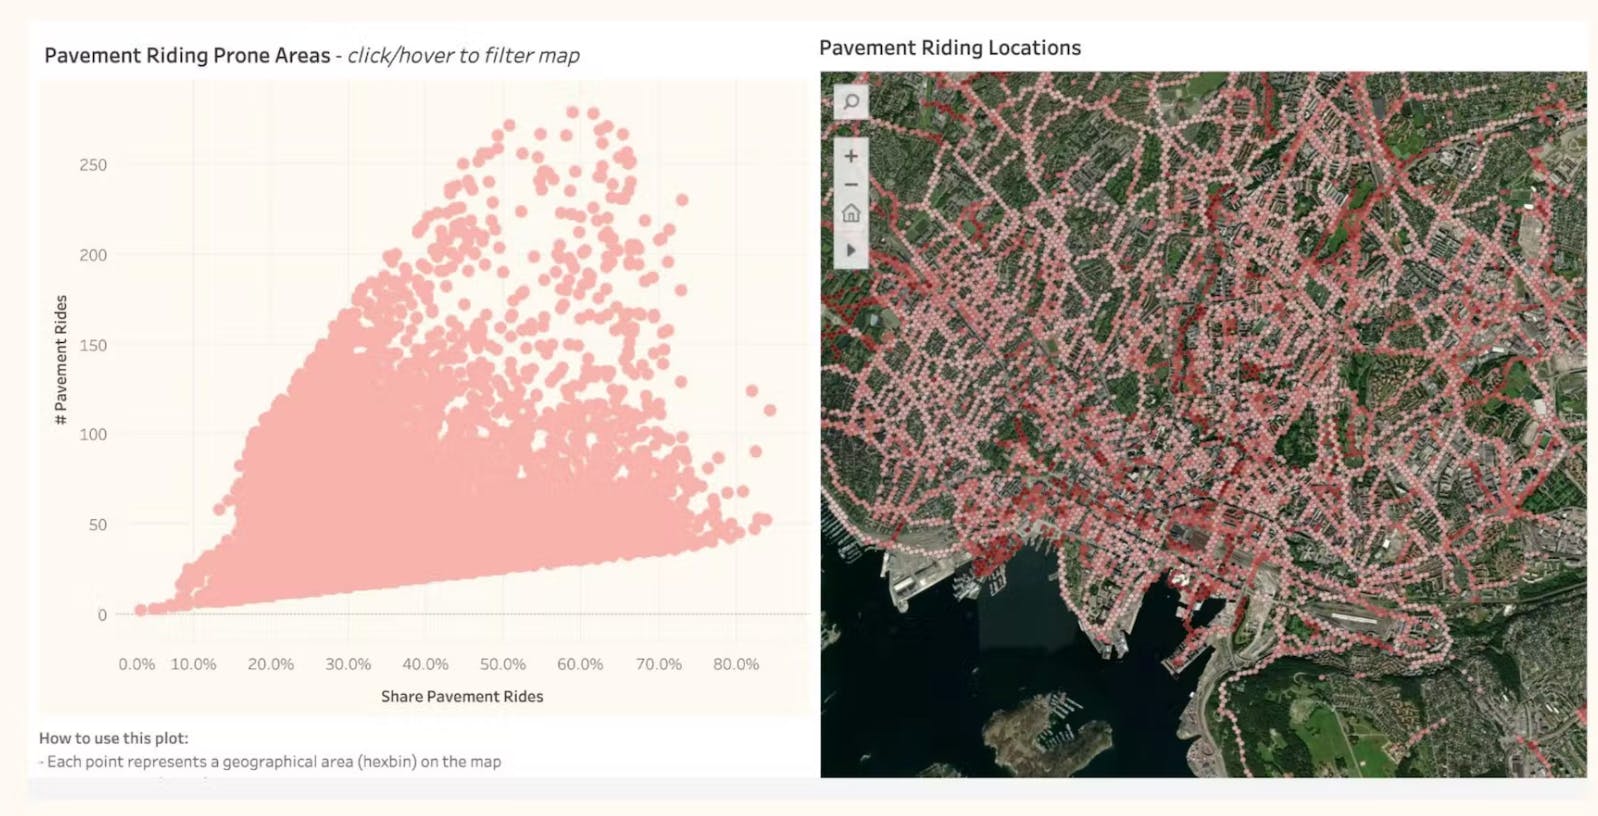
Enforcing this behavior can be done in a number of ways: for example by influencing riders or by working together with cities and municipalities on city planning. Voi has a team dedicated to these questions, but in order to make decisions, they need data.
To solve this, Voi has partnered with a company called Drover AI, and together they are running a pilot project where they put cameras in some of their scooters. They then run Machine Learning models to detect whether the scooters are being ridden on the street, on bike lanes or on the sidewalk. This gives Voi a better understanding of when users ride on the sidewalk, and it also allows them to notify the user, or reduce the speed of the scooter. From Voi's perspective, partnering with a company that specializes in this kind of product is very helpful. It allows Voi to focus on their business needs while Drover AI’s platform takes care of aspects like scalability and data privacy regulations.
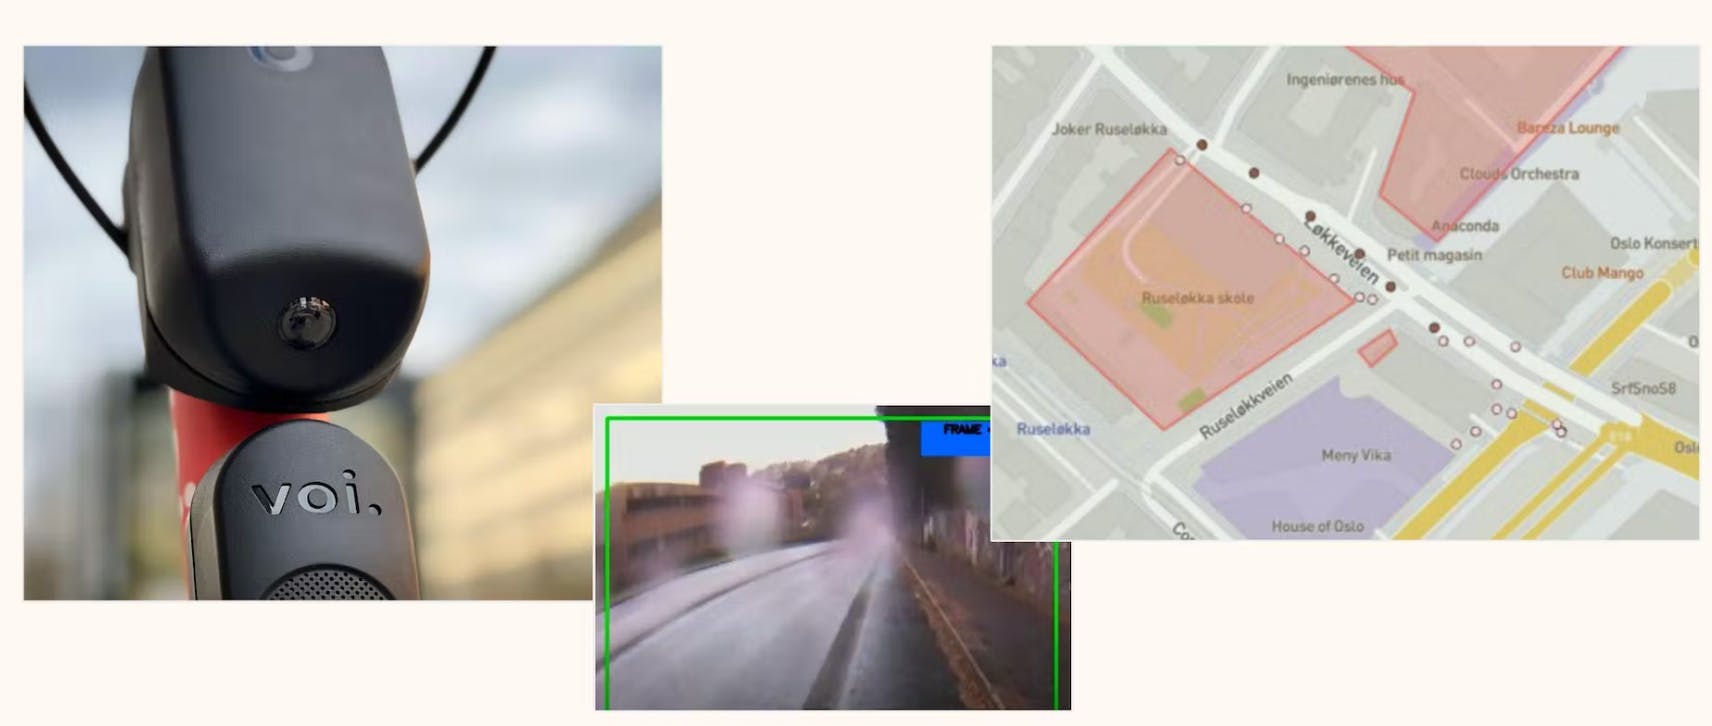
In addition, this enables the Voi team to plot the areas in the city where people ride the most on the pavement. This in turn allows the Voi team to collaborate with the cities and help them prioritize where they should invest in better infrastructure, such as bike lanes or reduced traffic speed.
What’s next at Voi?
Voi is always doing research on how to improve their tech stack to solve different business problems. There are already a few cool data projects in Voi’s pipeline, such as:
- Working on bringing data from OpenStreetMap into the data warehouse, to analyze how many rides end or start close to public transport stations.
- Improving hardware to support additional sensors on the scooters. Imagine having air quality or noise pollution sensors on scooters, and having a real-time map of the city and where there's most pollution!
- Improving tooling for geospatial analysis, especially on the reporting side. The Voi team envisions easy tools to allow more internal self-service analysis, but also more advanced tools for power users.
Closing thoughts
With that, we’ve covered an intro to geospatial analytics and how maps can be represented using points, lines, and areas. We’ve also discussed how Voi stores these data in Snowflake using a system of tools including Pub/Sub and Google Cloud Storage. Lastly, we talked about how Voi implements geospatial analytics using Uber’s H3 system, and how this enables some advanced use cases like query optimization and pavement riding analyses.
At Heroes of Data, we’re very thankful to Fernando Brito for coming to our meetup as a speaker, and for this great presentation. Thank you so much! We can’t wait to see what you and Voi will do in the future.
Summarized by Sara Landfors, based on the presentation by Fernando Brito at a Data Engineering Meetup by Heroes of Data in November 2022. Muhammad Fasih Ullah at Voi also contributed to the content and the work.
