

Heroes of Data is an initiative by the data community for the data community. We share the stories of everyday data practitioners and showcase the opportunities and challenges that arise daily. Sign up for the Heroes of Data newsletter on Substack, follow Heroes of Data on Linkedin to make sure you get the latest stories, and apply to join the community here.
If your company makes decisions based on data, chances are you use a BI tool. It might be Looker, PowerBI, Tableau, or any of the many others out there. But how do you decide which is the right one for you? The data team at Mentimeter—an audience engagement platform—went through a thorough process to choose their new BI tool, and in a talk by Annika Dukek and Samantha Lam, the Heroes of Data community engaged in their do’s and don’ts along the way. In this article, we summarize it all!
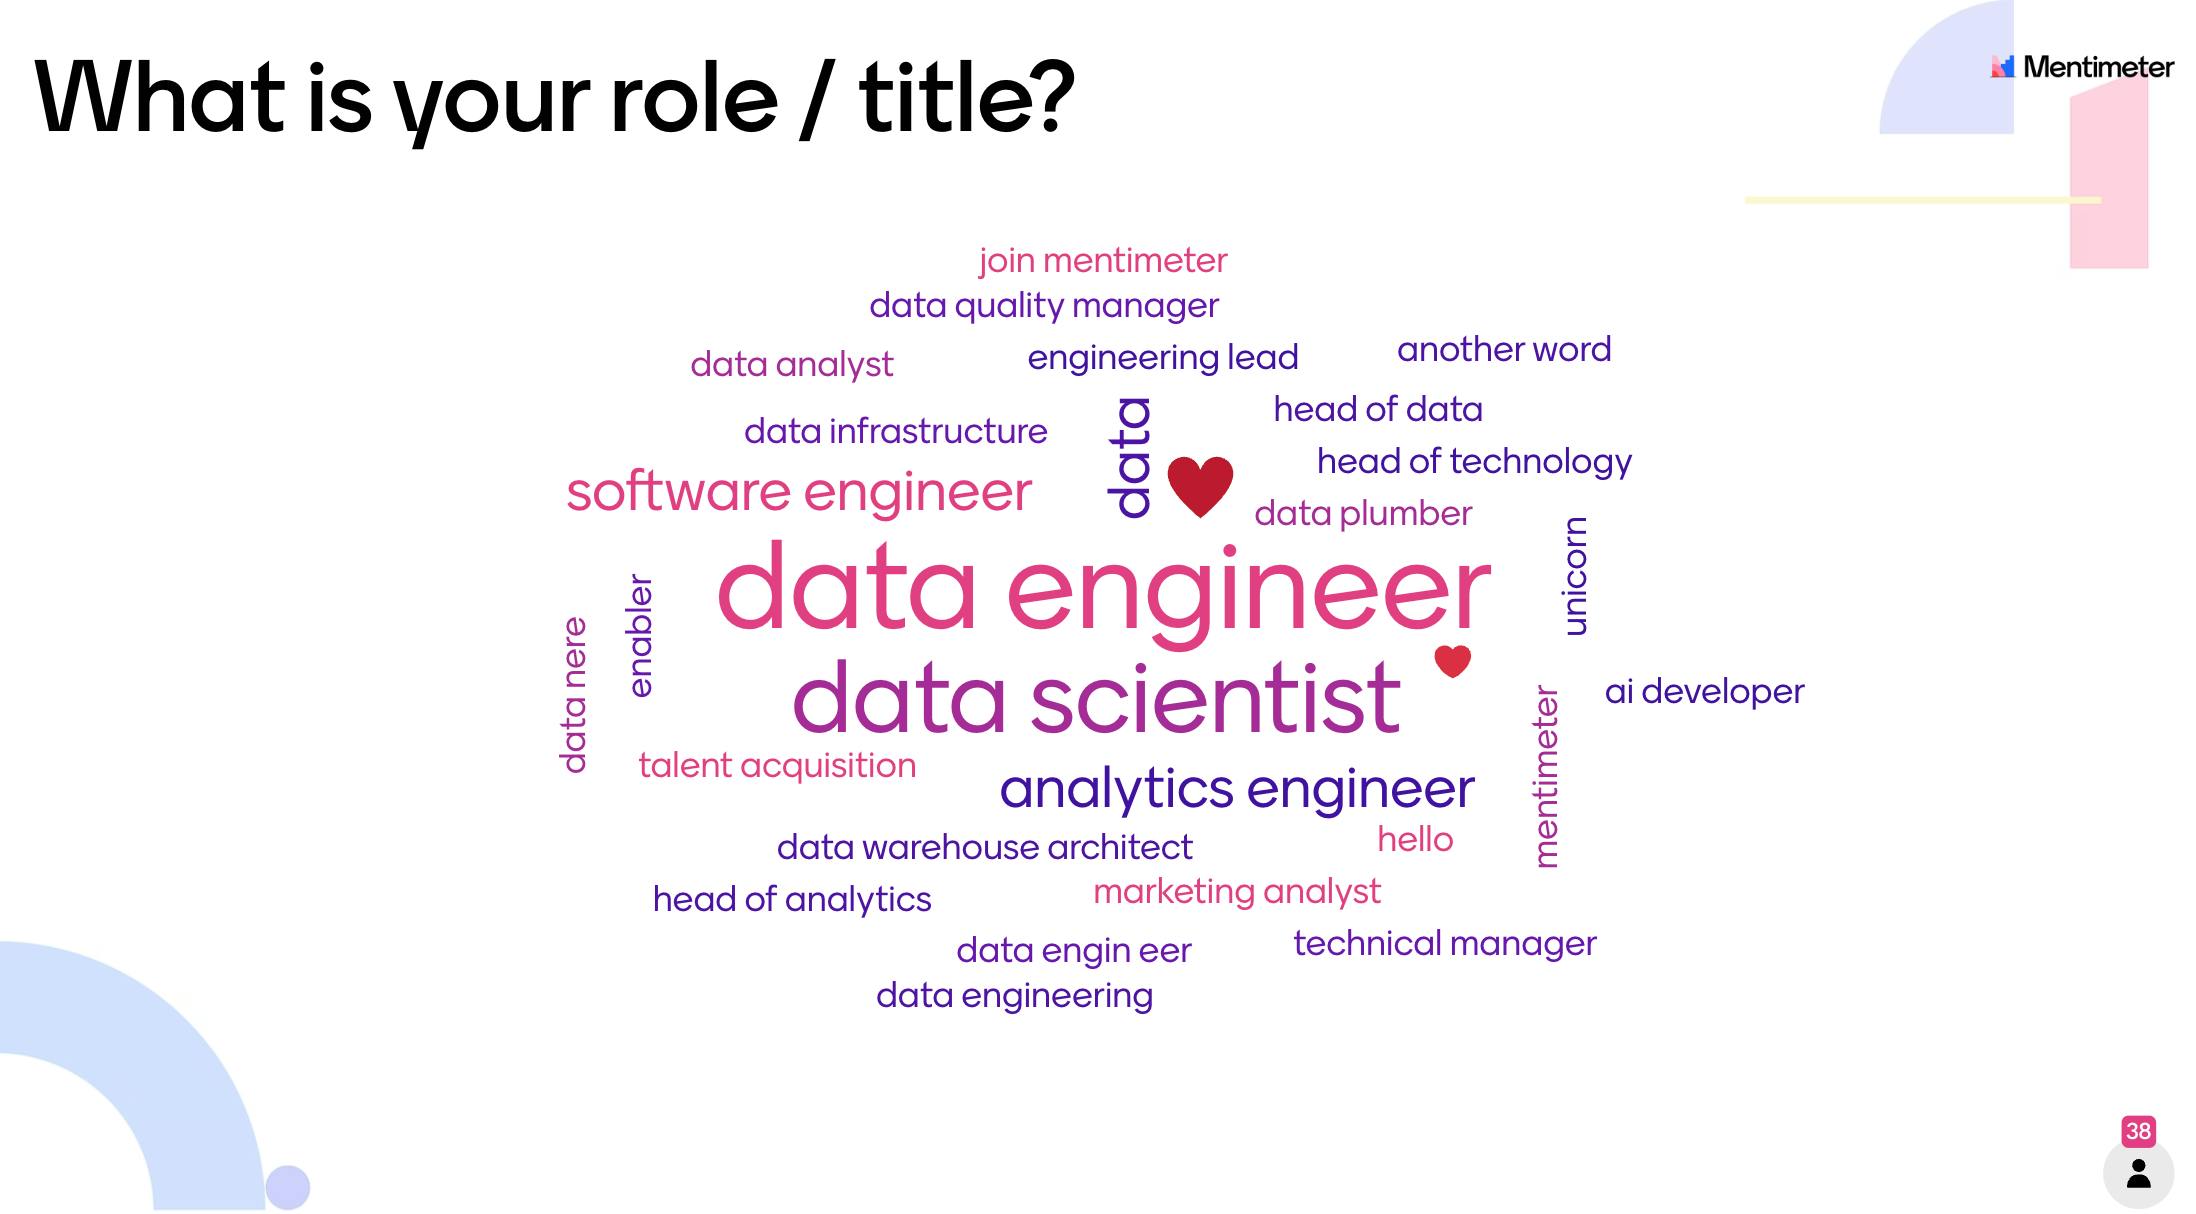
Annika and Samantha initially presented the contents of this article at a talk at a Heroes of Data Meetup in Stockholm during the fall of 2022. In the audience of the Meetup were many different data professionals, including data engineers, data scientists, and analytics engineers (see roles below).
We’ll first introduce Annika, Samantha and Mentimeter. Then we’ll describe Mentimeter’s need for a new BI tool, before laying out the process and the learnings the project team had along the way.
Who are Annika Dukek and Samantha Lam?
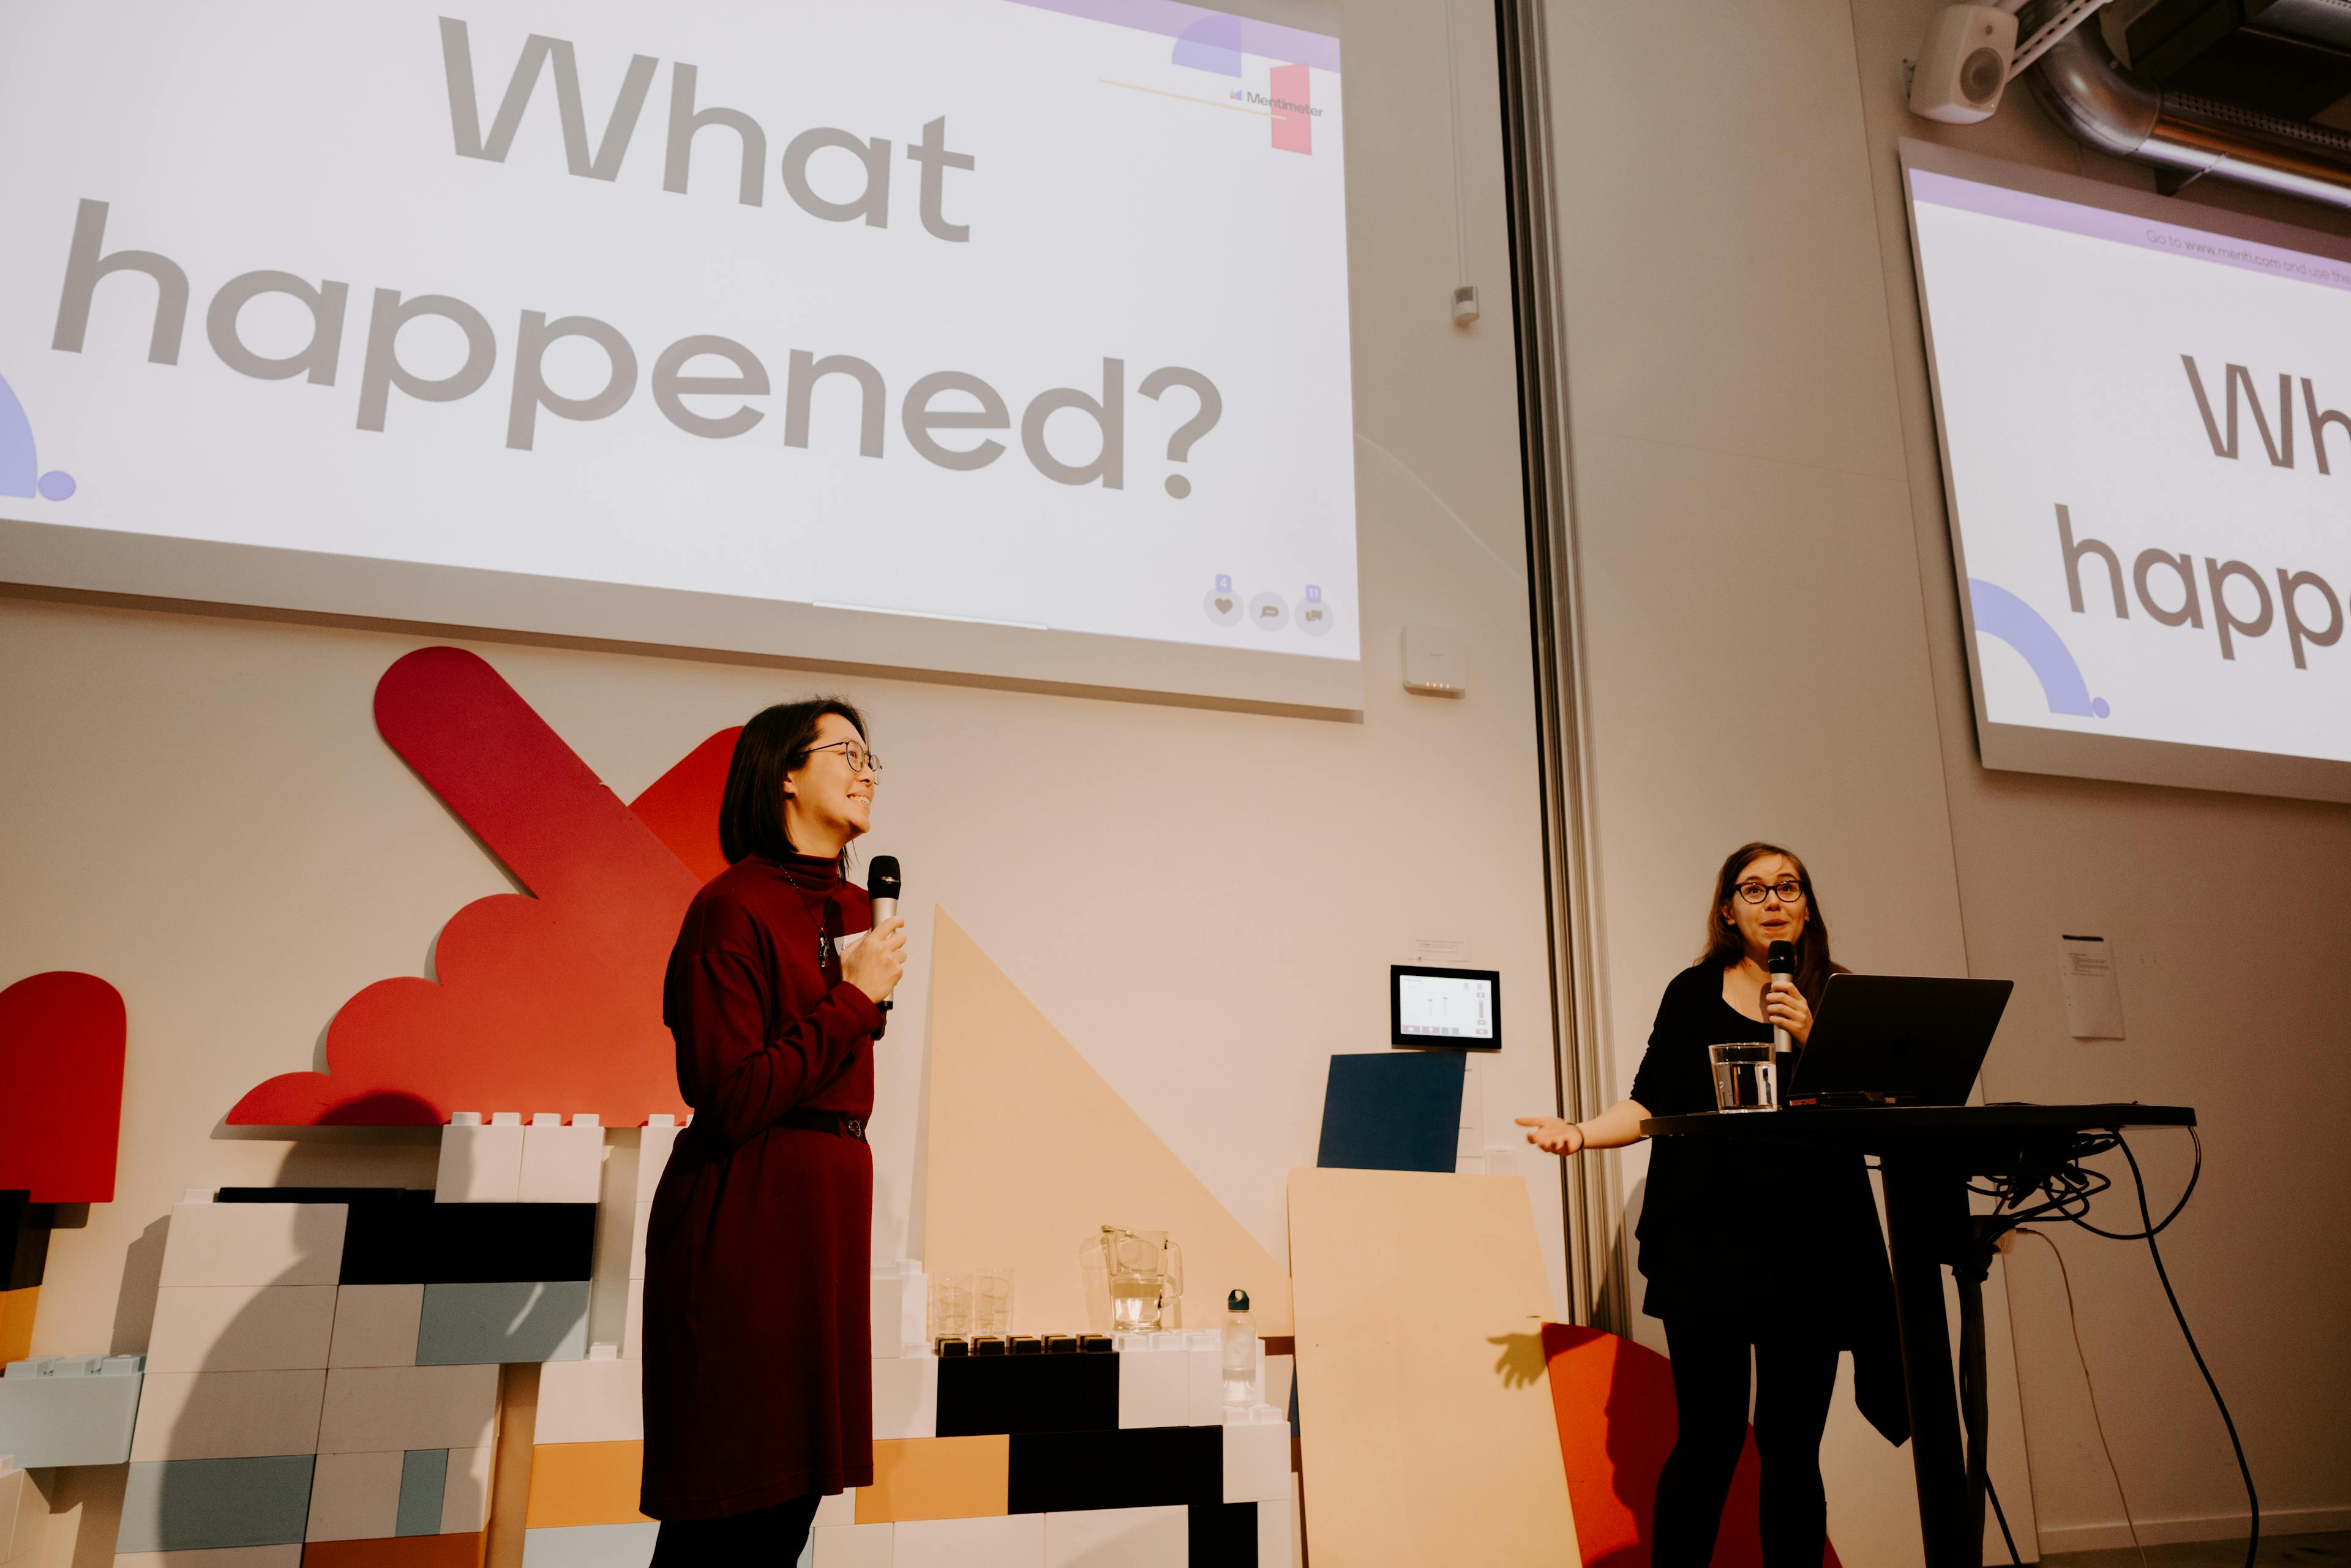
Samantha Lam is former Director of Data Science at Mentimeter and has more than 12 years of hands-on- and leadership experience in data work from companies including King and Xanadu Consultancy.
Annika Dukek works as Analytics Engineer at Mentimeter and also has more than eight years of experience in various analytics roles—ranging from pricing and revenue management to data science and analytics engineering.
Annika and Samantha walked us through the steps required to choose a BI tool for Mentimeter and the learnings they had along the way. However, they didn’t do this alone, as they are part of a larger data team at Mentimeter. Let’s have a closer look at what Mentimeter does and what role data plays there.
What is Mentimeter?
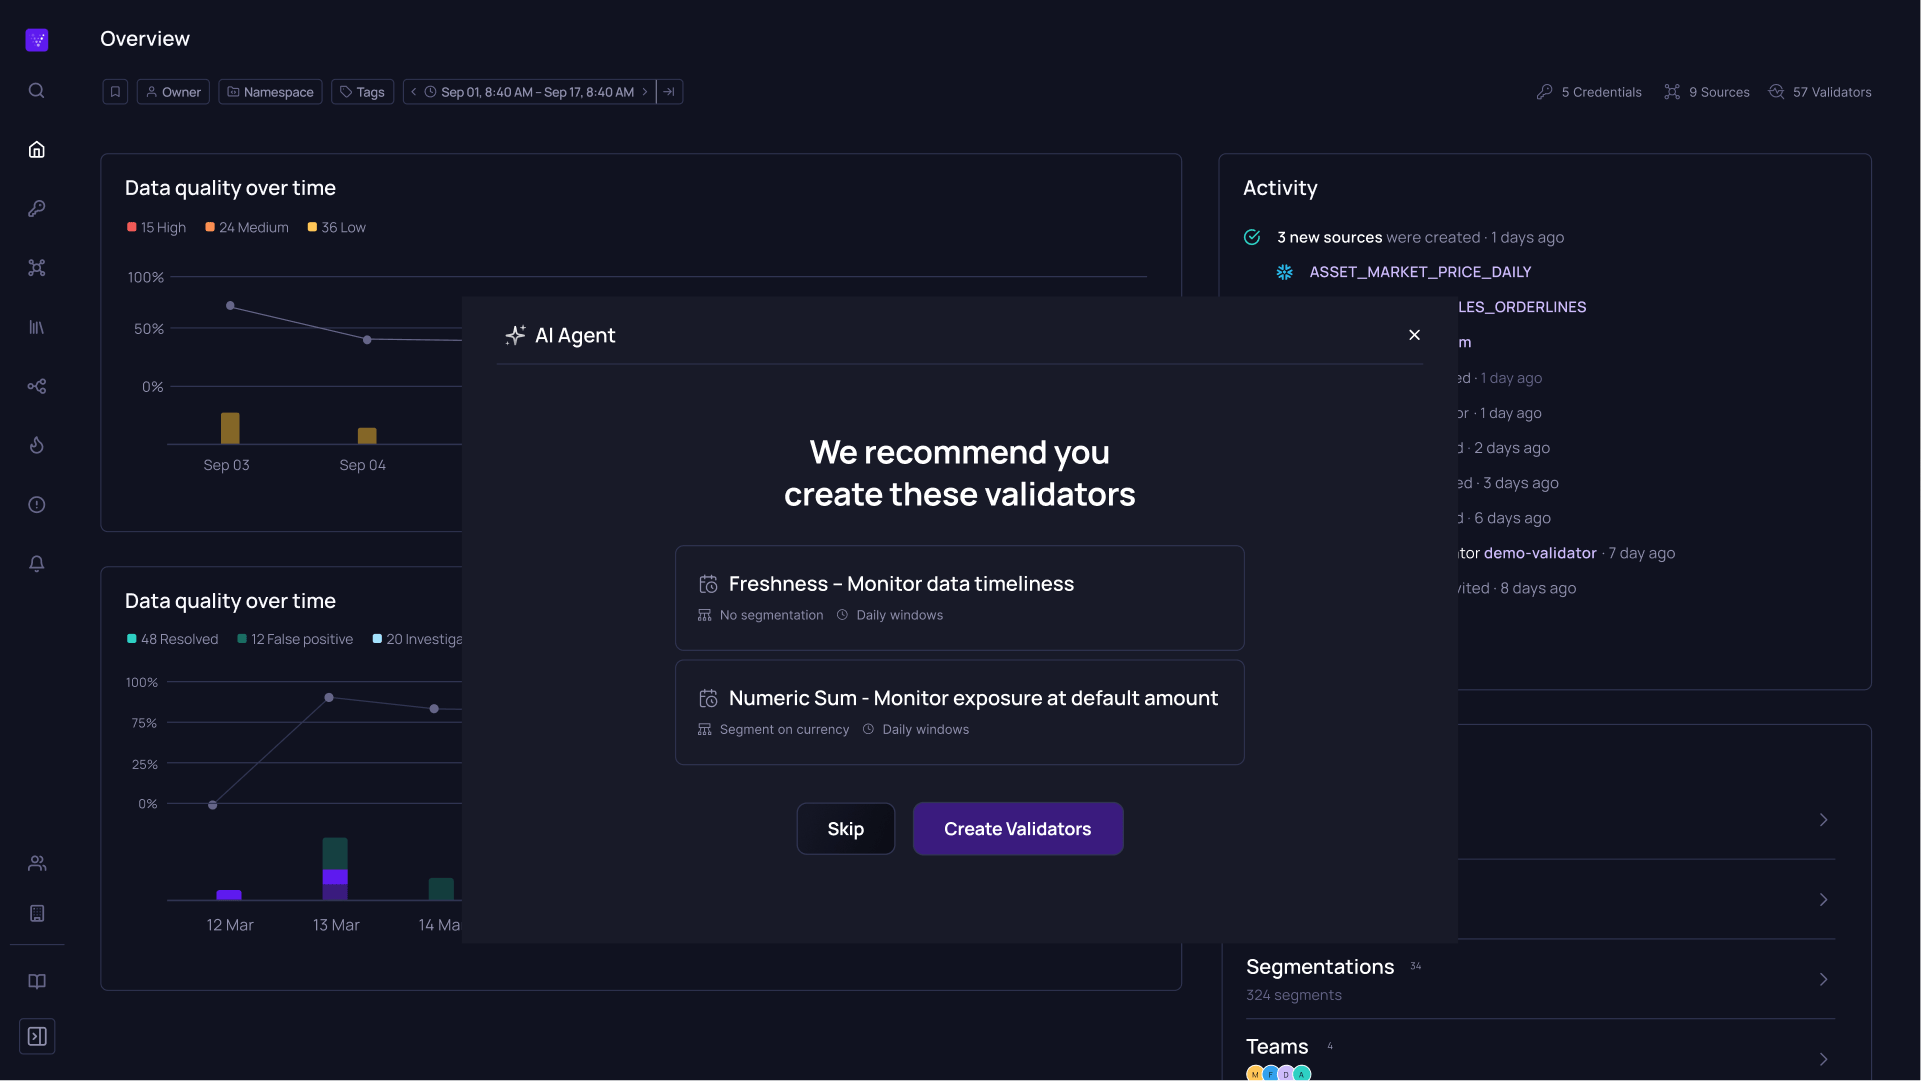
Mentimeter is an audience engagement platform that allows meeting, workshop, and trainings leaders to turn a passive group into active participants through real-time interactivity - whether on-site, remote, or hybrid. In fact, the entire presentation from this Meetup was presented in Mentimeter. This allowed the audience to engage with the speakers through reactions, comments, and by asking questions in an open Q&A on their smartphones. The Q&A functionality also allowed the audience to see others’ questions and to upvote those they most wanted to be answered. All in all, using Mentimeter was a great way to make the presentation even more engaging, fun, and interactive. Later in this article, you’ll see some screenshots from the live action that happened during this talk.
And it wasn’t just us who love the tool. Mentimeter has customers worldwide using the platform, which generates a lot of data for the data team to handle and make useful for the rest of the organization. The data team has around 20 people, and their main responsibilities include providing analytics and insights for the wider Mentimeter organization and building and maintaining the data infrastructure required to enable that. In this talk, Samantha and Annika zoomed in on one very important piece of that puzzle: landing on a new BI tool.
NB: Throughout the text, we will keep Mentimeter’s current BI tool anonymous to focus the text on the process and the learnings instead of on the technology. That’s content for a separate article!
The need for a new BI tool at Mentimeter
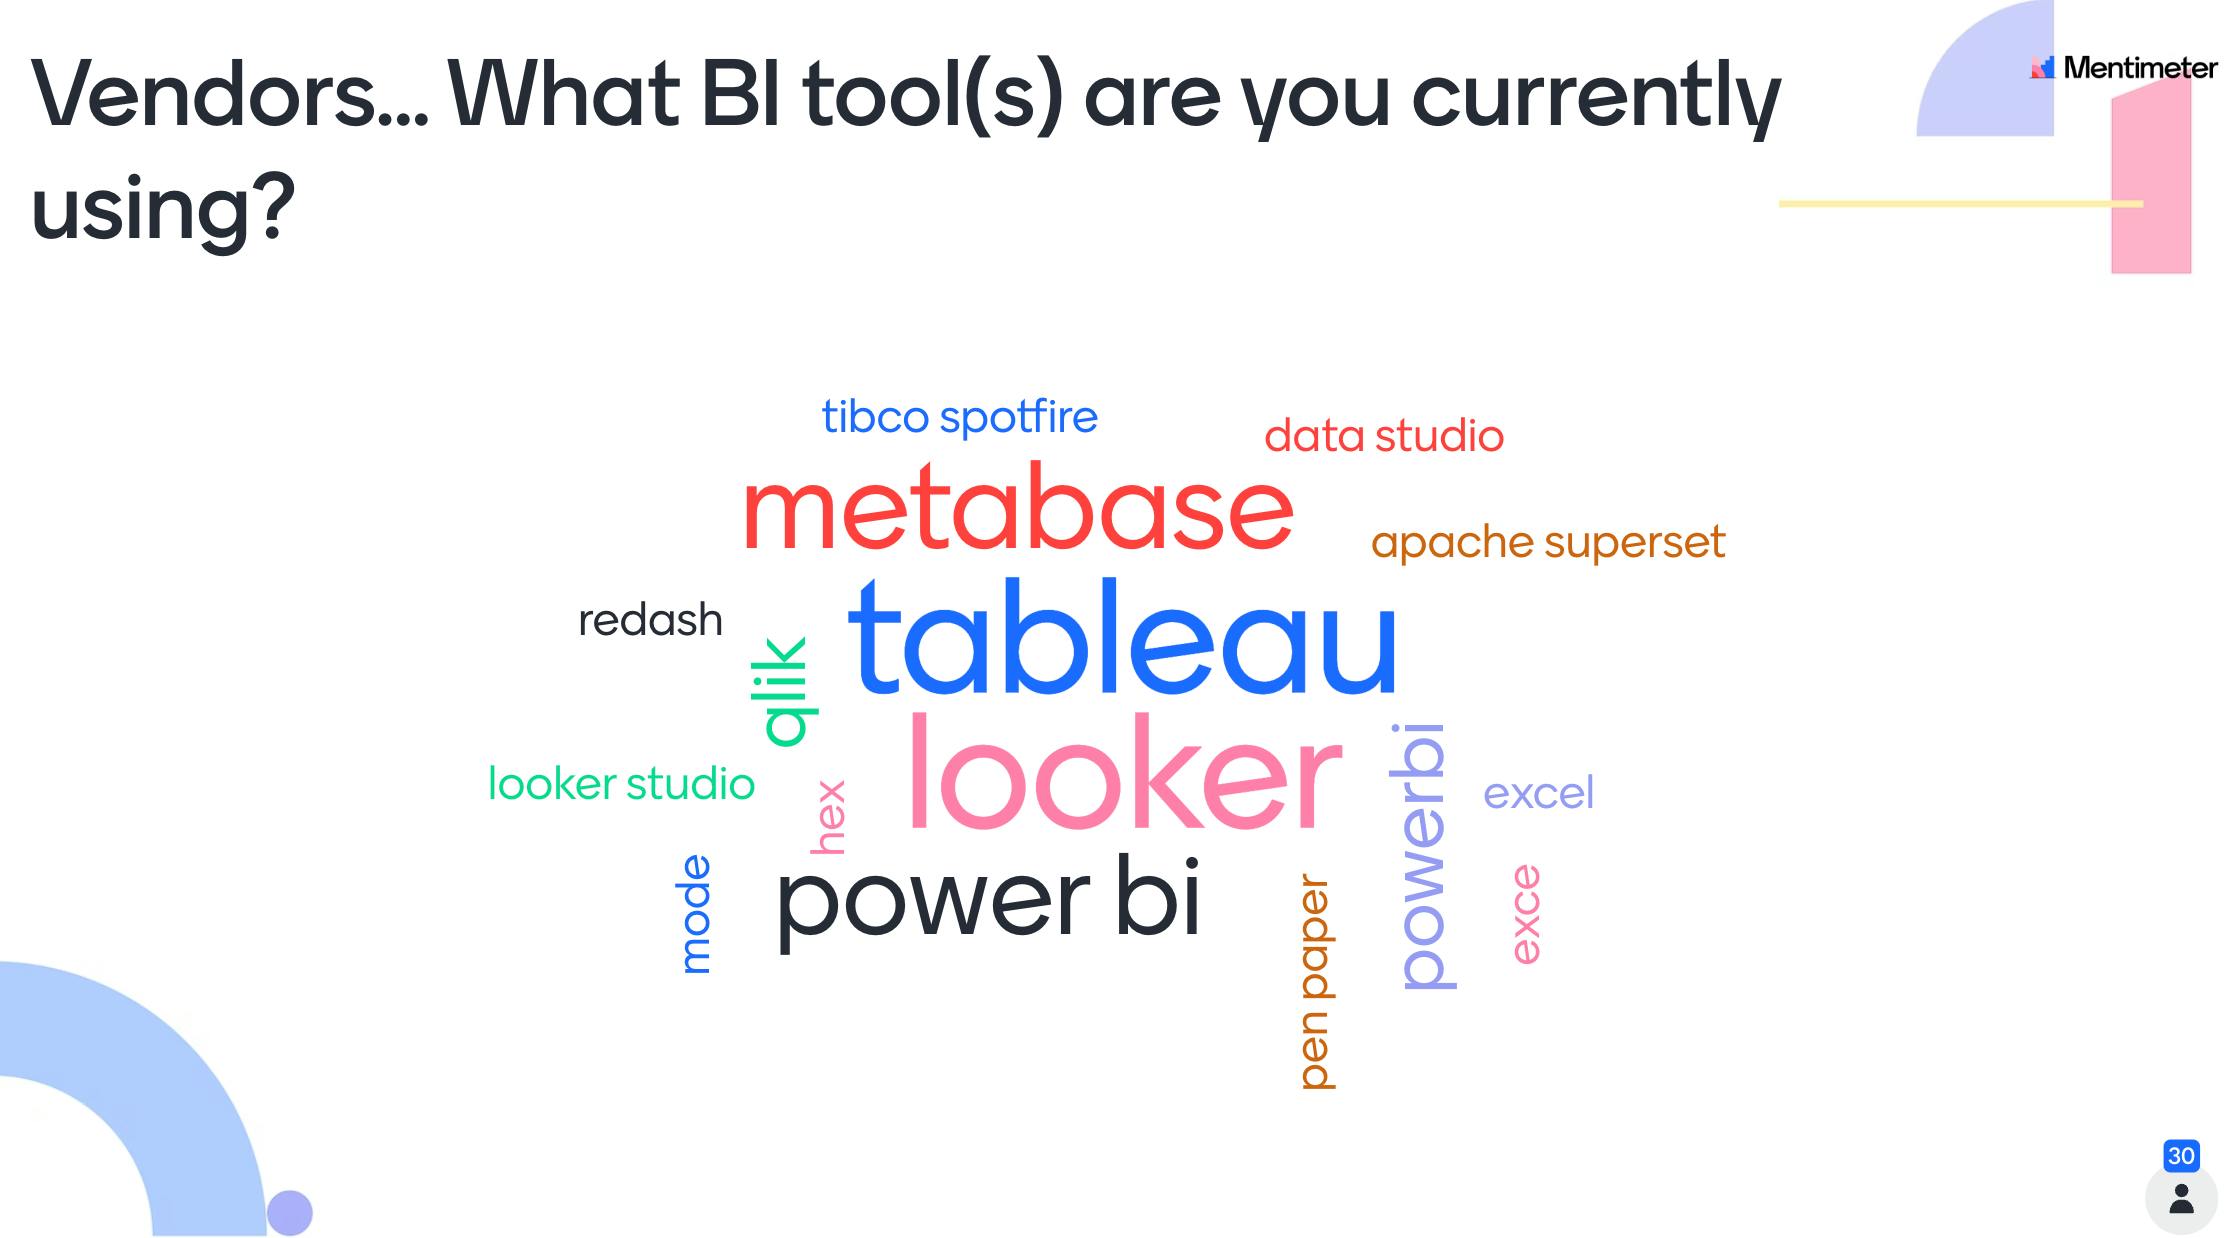
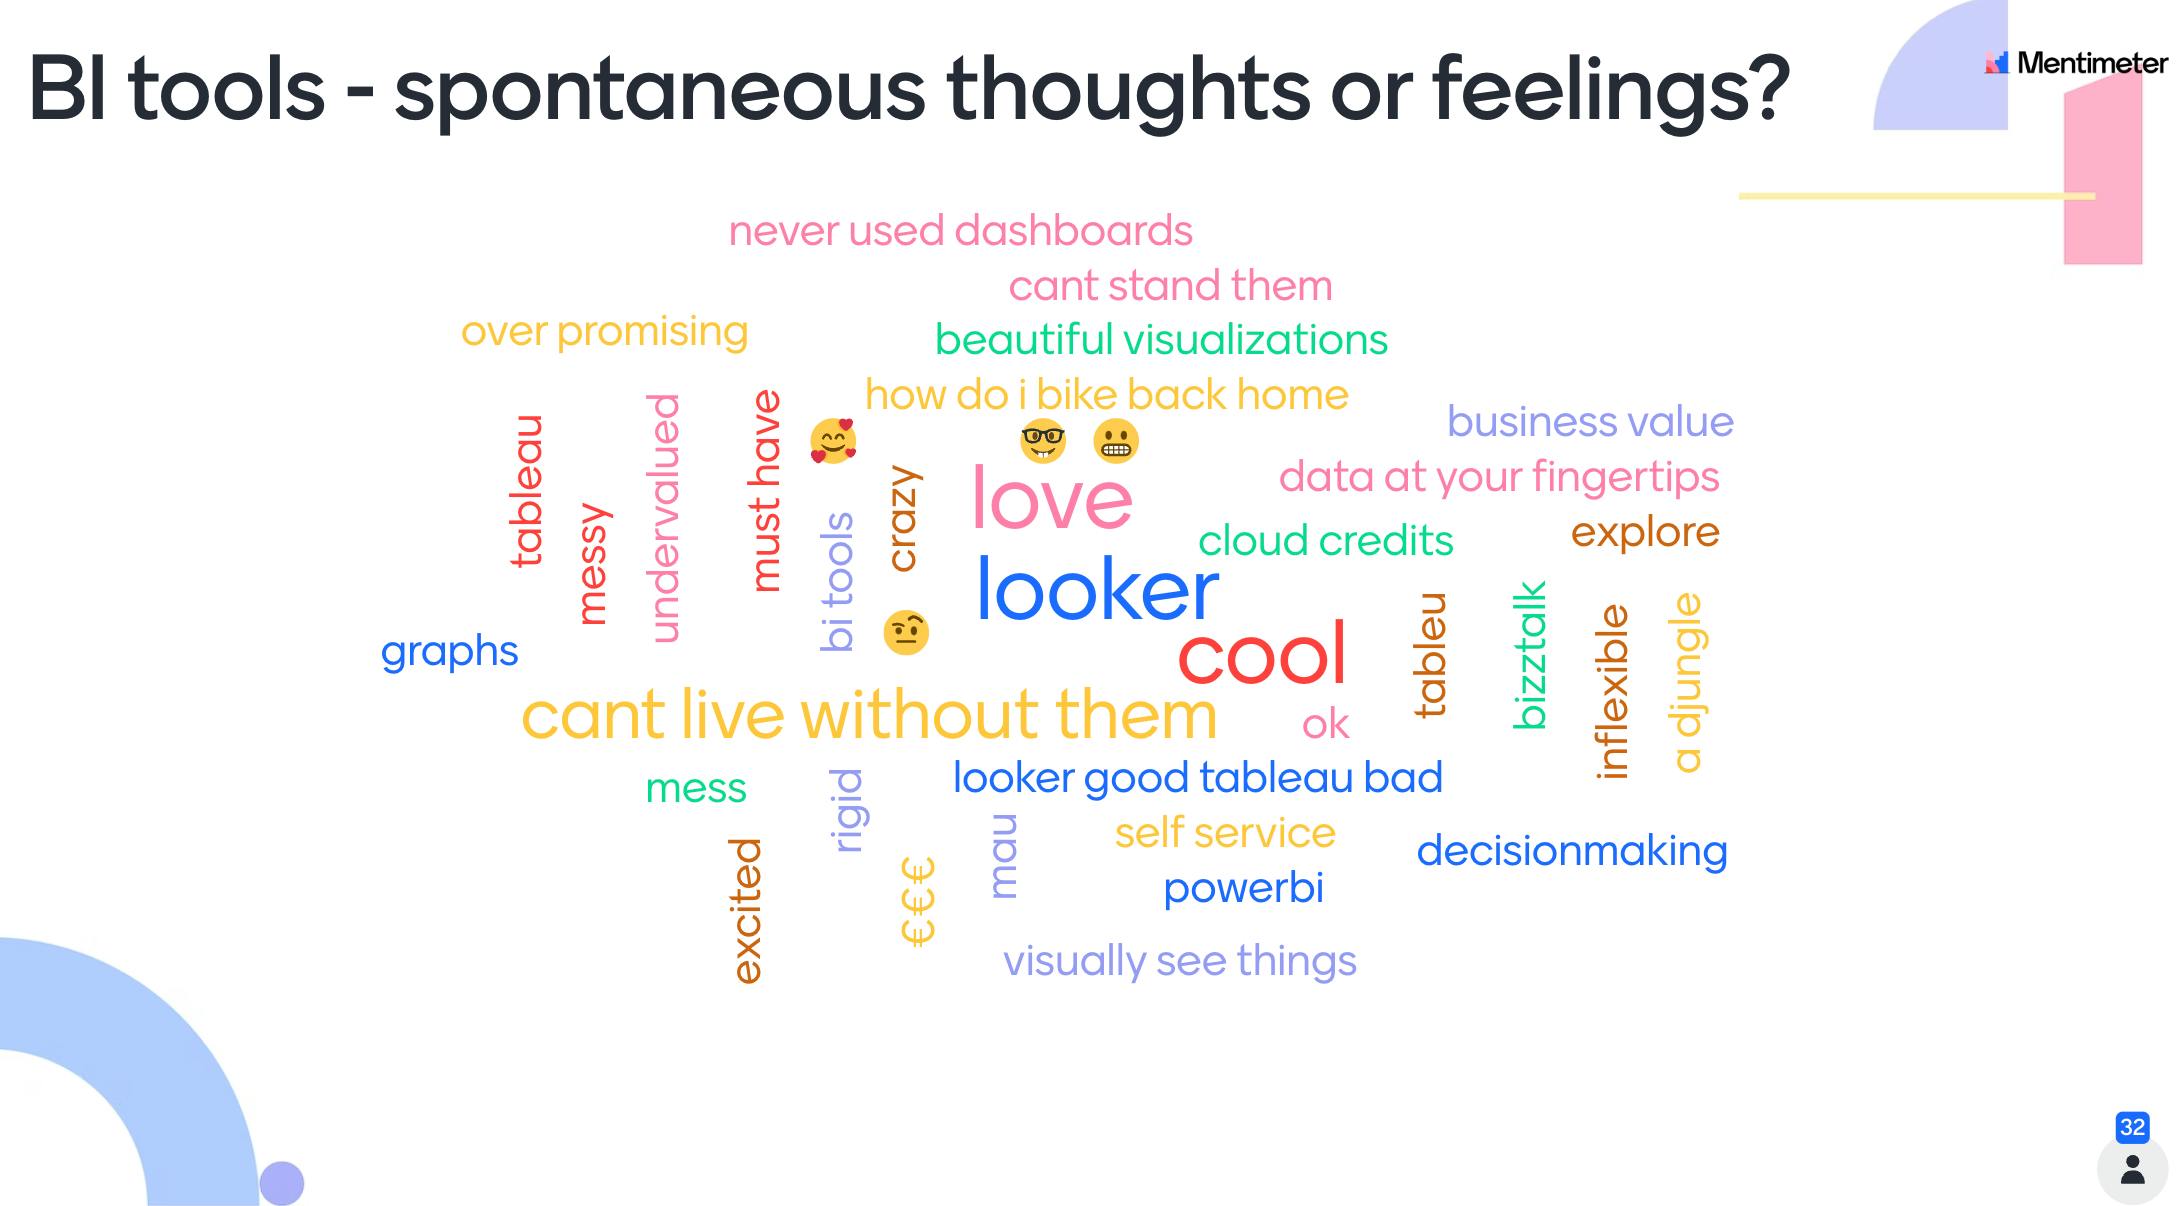
Annika and Samantha started their presentation by asking the audience about what tool they currently use, as well as their spontaneous thoughts and feelings about BI tools. The answers to the second question were widespread, ranging from “rigid” and “inflexible” to “cool” and even “love.” Perhaps this pinpoints the difficulty of actually finding the right tools for each data team’s needs. Some might get it entirely right, whereas others get it wrong and end up with something that doesn’t fully meet their needs.
Mentimeter certainly didn’t have a BI tool that met their needs back in 2021. This was characteristically summarized by Annika in one sentence: “This really isn’t working out for us anymore.” There were a number of events that had led Mentimeter up to this point. Back in 2018, Samantha joined Mentimeter as the first data hire in a company of about 30 employees. She quickly implemented a BI tool solution—self-hosted Metabase—that was great for the particular context Mentimeter was in at the time. However, as the company grew to the 300+ people they are today, things got a little bit out of control, resulting in a system with little governance and understanding of what parts actually brought value to the business.
Annika points out, however, the painful reality of the situation made it relatively easy to get buy-in from management on the need for a new BI tool. The data team held full control of the project with great support from external stakeholders
What the Mentimeter team did, and lessons learned
The team had a plan. But the plan got derailed by a lack of vendor contact, plus extra demos for stakeholders, leading to a delayed decision.
How the project ended up actually being run (original plan vs changes):
1. Gather tool options & requirements
2. Reduce options for trials, contact 2-3 vendors
3. Trials:
a. Evaluate tech requirements of tool 1
b. Evaluate tech requirements of tool 2—and negotiate!
c. Perform usability testing of tool 1 vs 2
d. Demo with management stakeholders
4. Delay the decision
There were four key learnings along the way. Let’s take a closer look.
1. Pre-work on tool options and gathering requirements
All in all, the project team was very happy with the pre-work they did. Mapping out the option space was relatively easy and valuable for efficiency, as was gathering requirements for what the tool should be able to do. Samantha mentions that “the project group with different representatives was great.” It included data engineering, analytics engineering, data science and VP of data representatives. This enabled a holistic overview of requirements that would serve the whole company.
Another thing Samantha mentions she would do again is to narrow down the list of potential tool vendors very early on. Pruning the list of vendors, such as marketing or product analytics tools, significantly reduced the amount of work that needed to be done later in the project.
There were a lot of options that could be quickly ruled out since they were more marketing analytics or product analytics-type tools as opposed to BI. Pruning the list of vendors significantly reduced the amount of work that needed to be done later in the project.
Lastly, in terms of pre-work, Samantha mentions she was very happy with the decision to split out the requirements list into two: one for the technical requirements and one for the stakeholder business requirements. This enabled the project team to clearly understand what the need-to-haves were vs nice-to-haves for each type of user. This in turn helped the project team avoid being sidetracked by nice demos and great sales pitches.
2. Contact BI tool vendors
When contacting BI tool vendors, the project team experienced very high variation in terms of the quality of vendor calls, and their different approaches to free trials. Some vendors would provide an SDR (Sales Development Representative) who often was unable to answer the more technical questions the project team had. Some vendors, on the other hand, brought a Sales Engineer to meetings. Samantha recommends that if given the choice, the Sales Engineer is the type of person you want on the call because they will be able to help answer all technical questions. For example, version controlling and details of how data is being transformed under the hood are questions that would be best directed to a Sales Engineer.
Some vendors would provide an SDR (Sales Development Representative) who often was unable to answer the more technical questions the project team had. Some vendors, on the other hand, brought a Sales Engineer to meetings.
Responses from tool vendors were also a varied experience. In Annika’s own words “this is where it got weird.” E.g. It was impossible to get in touch with a salesperson for one vendor, so the team had to negotiate a demo and usability testing. Some vendors made free trials easy, but others were difficult; one even wanted Mentimeter to bring management and stakeholders to a demo - despite hearing that the data team had full decision-making mandate! In short, some vendors wanted to shoehorn Mentimeter into their sales processes, while others were more flexible.
3. Trial o’clock—and learnings along the way
At last, the project team was able to secure trials with their top choices, which brings us to the phase of the project dubbed “trial o’clock”! The team wanted to ensure they tested the tool with every stakeholder and in every single way:
Business user testing:
1. Usability testing for business users.
Technical user testing:
2. Usability testing for data engineers, analytics engineers, and admins.
3. Usability testing for data scientists and data analysts.
All types of testing turned out to be hugely valuable. Let’s take a look at the learnings in detail.
Usability testing for business users
When discussing usability testing for business users, Annika explains “This turned out to be way more useful than I initially thought it would be. I had thought, ‘I work with data, right? How hard can it be?’ but in reality, business users had completely different needs versus me.” Her favorite tool turned out to be the least liked one for business users as they thought the interface was unintuitive and much too technical. Doing usability testing for business users also helped the project team focus on what they really needed the tool to do: serve the business, and “unfortunately not just picking a fun toy for data engineers and data scientists.”
Doing usability testing for business users also helped the project team focus on what they really needed the tool to do: serve the business.
The project team learned two key lessons: onboarding beta users is vital and preparing a realistic use case is necessary to get quality feedback. Mentimeter learned from not doing the first one the hard way, and they got more feedback about not knowing where to look for features, rather than evaluating them. However, the time spent on creating a test case that accurately reflected reality, which they did do, was worthwhile.
The project team had a surprising insight: they got way more out of the qualitative feedback than they did from the quantitative feedback.
Lastly, the project team had a surprising insight: they got more insight from the qualitative feedback than the quantitative feedback. Annika explains the quantitative questions weren't reliable due to sample size and moreover, users didn't think enough about them. Open-ended questions and live usability testing, particularly encouraging users to think out loud, provided the most valuable observations about what business users liked and what they struggled with.
So far, so good! Let’s now look at some of the project team's learnings from the technical users.
Technical usability testing
In terms of technical usability testing, one overall learning for the team was time management. Specifically, Annika says it would have been best to actually use the BI tool to prepare the use cases for business usability testing with the tool itself. The benefits would have been twofold: a more accurate reflection of the future support reality, plus only one preparation effort for both the business and technical usability testing. In addition, it would have helped the project team avoid the painful realization that just because a vendor claims to have a feature doesn’t mean they actually do …
Another example of a time management learning came in the shape of how to divide the work of testing the tools. The project team split testing by tool for time efficiency, but the dialogue afterward was not constructive. If they could do it over, they'd split testing by feature area instead e.g. with groups testing data integration, user admin, and dashboard building, separately between tools.
When all of the testing with all of the different users was done, it was finally time for decision-making!
4. Decision time—documentation and debate
Making the final decision, in the end, was relatively easy. Samantha explains that the project team had put all documentation throughout the process into one single master document. This is something that really helped the final decision, as it made it easy to go back and pinpoint why certain arguments had been made and what the discussion had been that led up to certain mini-decisions.
Nevertheless, comparing tools with the requirements laid out at the beginning of the project wasn’t always straightforward. One requirement might mean something in one tool and something completely different in another. Version control is one example of such a requirement. Does it mean version control on the dashboard level or version control on the data transformation layer, or something else? The project team had to go back and revise some of the requirements to make sense for all tools and provide a fair comparison in the end.
The project team always compared any new tool to their existing one and determined if more time on the old tool could work instead.
Furthermore, the project team always compared any new tool to their existing one and determined if more time on the old tool could work instead. This helped them make the best decision.
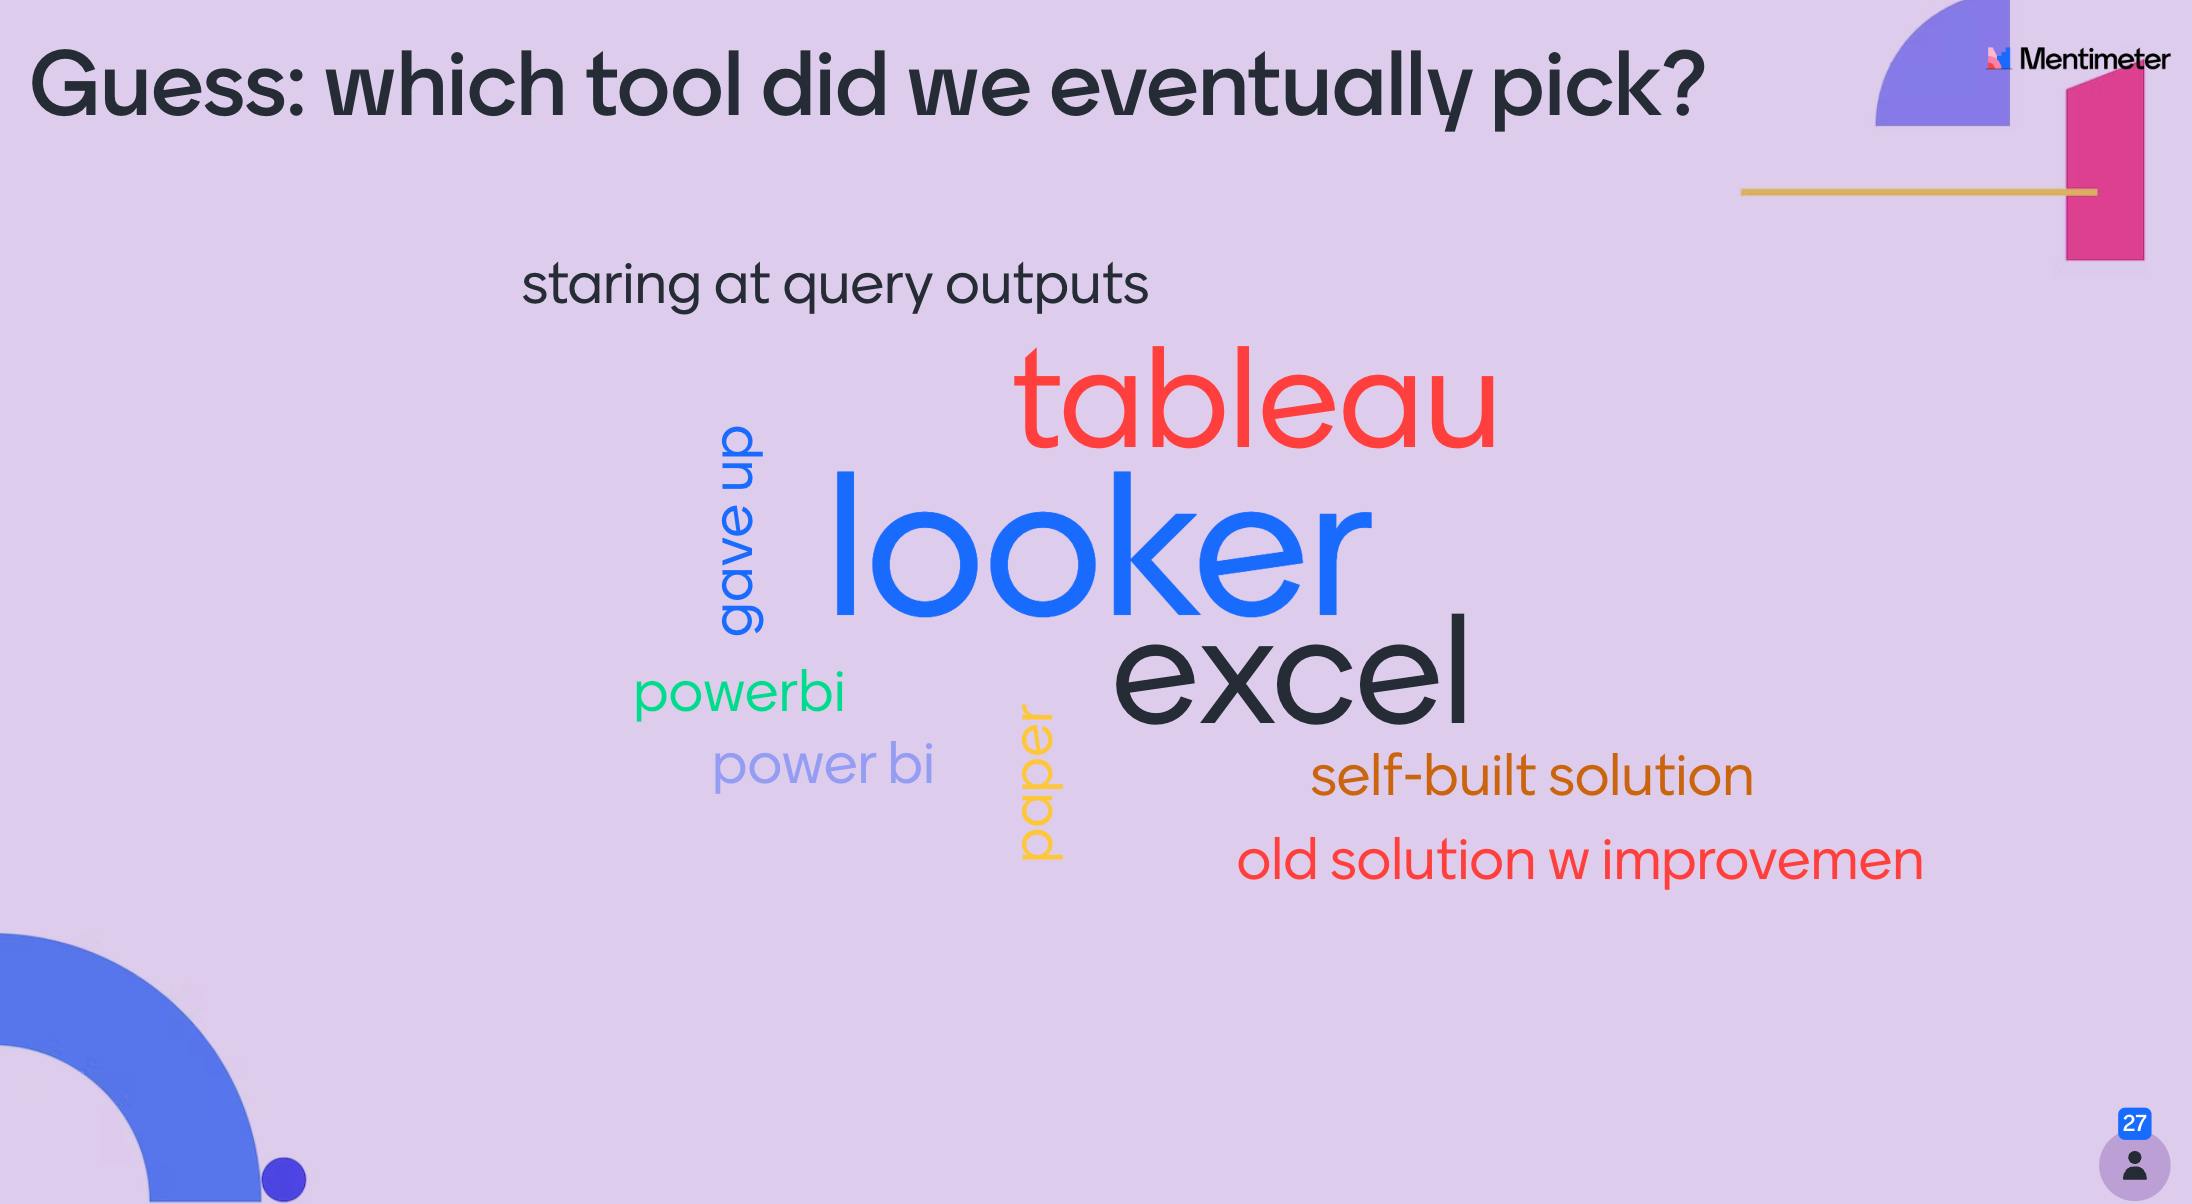
Lastly, the team made sure to set aside plenty of time for the diverse group of stakeholders in the project group to discuss and debate. They took half a day to debate different options and eventually land on a decision that everyone felt confident with. Which tool do you think they chose?
Closing remarks
BI tools come with a wide range of emotions and preconceived ideas. Nevertheless, as Samantha and Annika convey during their talk, the right BI tool might be one of the most fundamental things required to enable an organization outside of the formal data team to become data-driven. We can’t help but be very impressed with the thoroughness the project team applied to selecting the right tool, and wish them all the best in their journey of continuing to roll out the tool.
Summarized by Sara Landfors, based on the presentation by Annika Dukek and Samantha Lam at a Data Engineering Meetup by Heroes of Data in November 2022.