
Matt Weingartenis a Senior Data Engineer who writes about his work and perspectives on the data space on hisMedium blog—go check it out!
Disclaimer
This is the continuation of a series of posts I will be doing in collaboration with Validio. These posts are by no means sponsored and all thoughts are still my own, using their whitepaper on a next-generation data quality platform (DQP for short) as a driver. This post or collaboration does not imply any vendor agreement between my employer and Validio.
Introduction
So far, our journey of next-generation DQPs has focused on end-to-end data validation, supporting all the different types of validation rules, and how everything can be validated comprehensively. Another critical aspect of DQPs is notifications. After all, we need to keep everyone in the loop about the status of our data quality. How can we notify data teams and stakeholders about bad data?
Visual Representation of Data
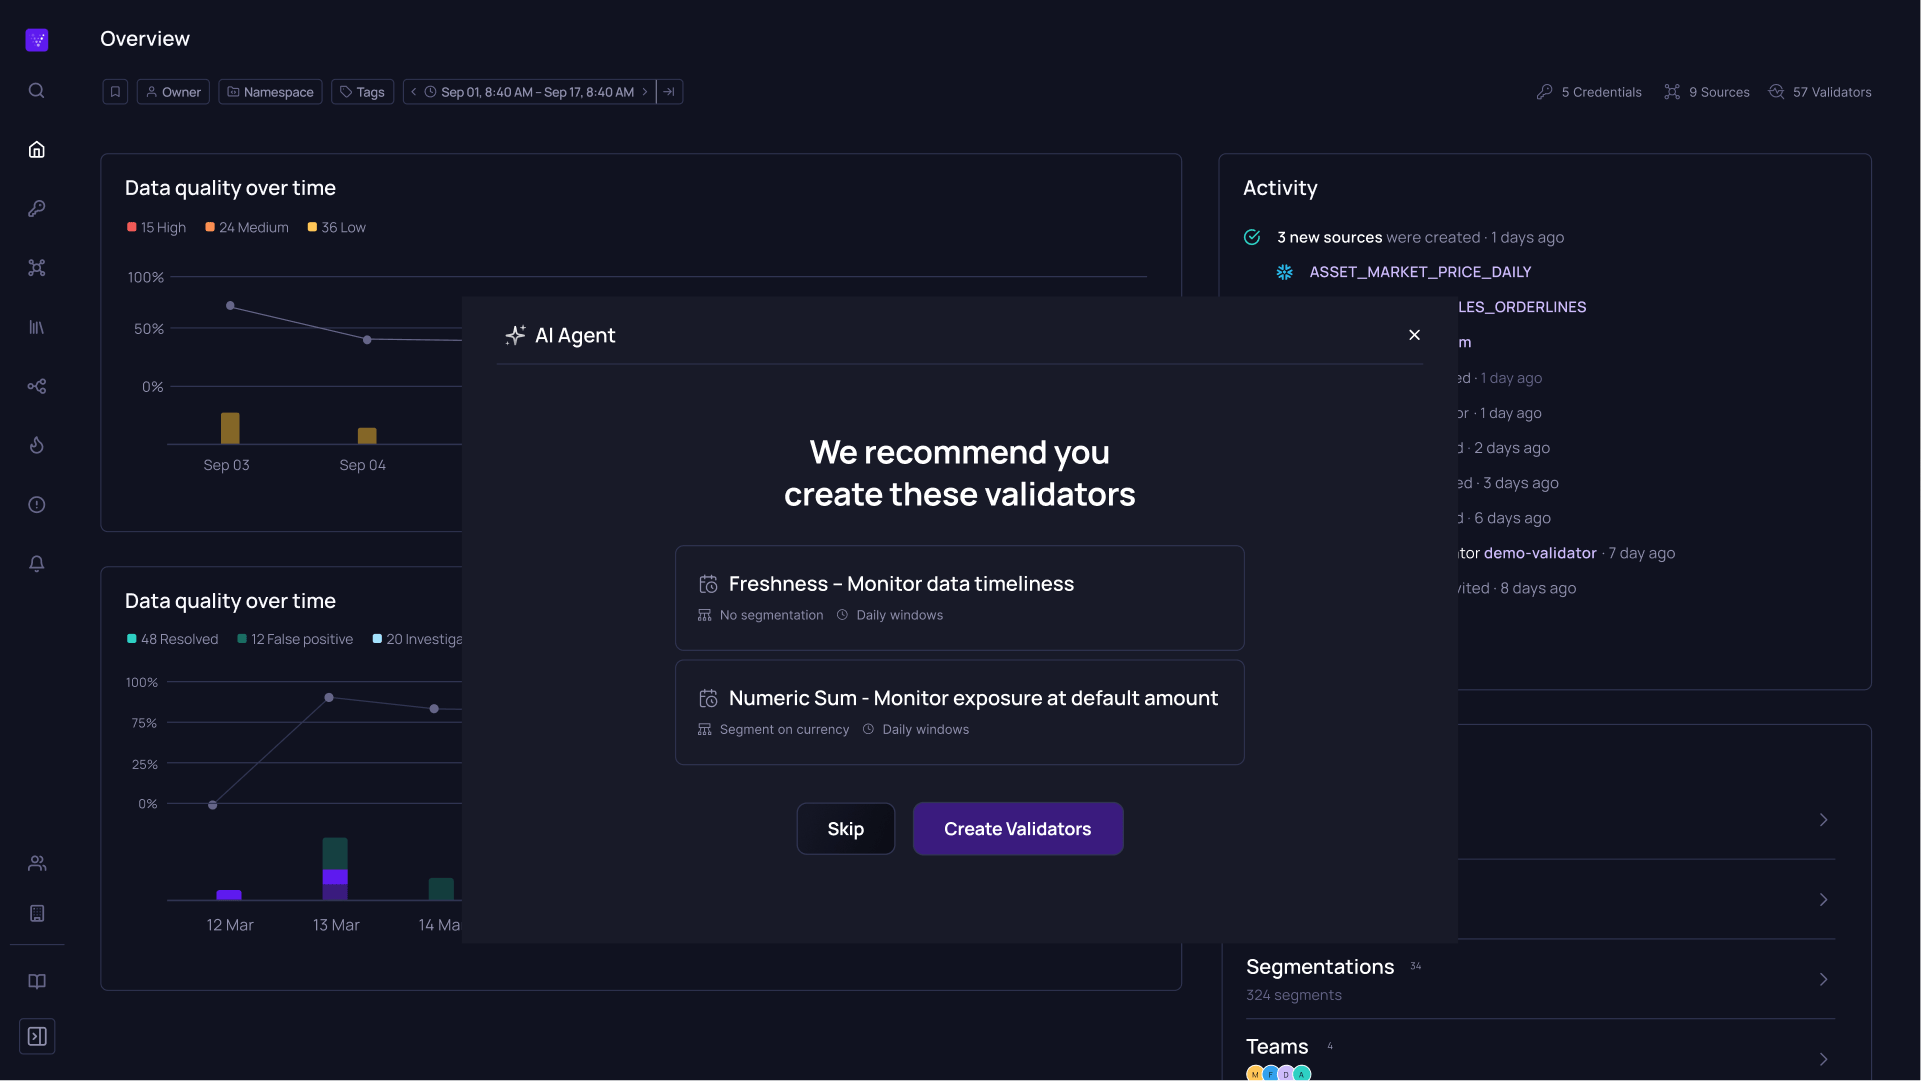
There’s a reason dashboards are as popular as they are today. Being able to properly visualize the expected state of data vs. its actual state with failures included is a powerful capability to summarize the bigger picture. This needs to go beyond just connecting a visualization tool to the data warehouse layer, however. Visualization should be properly integrated with the DQP so that a visual understanding of the data is a straightforward process.
The next iteration of my team’s data reconciliation effort has a goal to include a real-time dashboard for our consumers to see the status of our data and where it stands across all layers. Originally, this was planned to be done by connecting our visualization tool of choice to Snowflake. However, we should rather be thinking with a bigger picture in mind, seeing how a DQP could include this rather than building our reconciliation process to have this as a means to an end.
An additional advantage of having a visual representation of data is that it allows non-technical people to be involved in data quality efforts. As engineers, we need to be as inclusive as possible when it comes to involving the other roles we communicate with on a regular basis. Having visualization makes this more of a reality.
Collaboration Tooling Integration
Being able to capture data quality failures is one thing; notifying engineers about those failures is a separate and critical process. Next-generation DQPs should have built-in integrations with collaboration tools like Slack, email, PagerDuty, etc., so that engineers can quickly be aware of any failures that arise during processing.
Furthermore, the platform should be able to integrate with task management systems. Wouldn’t it be useful to have automated JIRA tickets whenever a failure arose? Of course, it’s important to tune the parameters around these integrations so that it’s not too noisy (no engineer would appreciate 20 notifications a day — something we’ll touch upon in more detail in the next post in this series), but it goes a long way into making sure the average time to remediation is as low as it can be.
This is another component that our data reconciliation efforts will include. All data feeds that show a significant difference between expectation and reality for a certain processing layer will be logged into Slack while we’ll fire off a more generic PagerDuty alert that notifies the team to look into the mismatches. This allows us to be more on the ball when it comes to keeping our overall system as up-to-date as it can be with good data.
Conclusion
Visualizations and notifications are two often overlooked components of an end-to-end DQP, but that’s not to mean they shouldn’t be included. Making sure that everyone gets a clear picture of failures as well as ensuring they are remediated in a timely manner should be considered a necessity.
In further posts of this series, we will be moving from the “catch” section of data quality failures to “fixing” them. How does a platform fix those captured failures to maintain high quality?